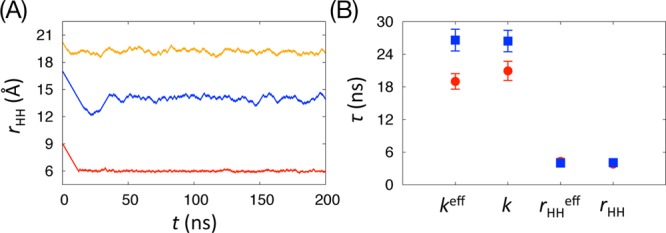
Figure 8.

(A) Time-series of windows center (rHH,i) for three windows (i = 19,59, and 75). (B) The average relaxation time τ of window parameters for IS1 (red) and IS2 (blue). The error bars are the standard errors of the average τ over the entire windows.
