
Figure 2.
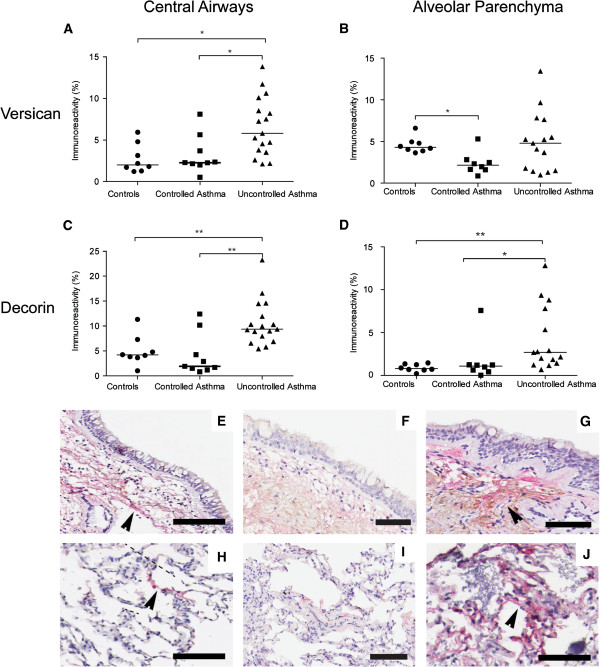
Percentage area of versican (A, B) and decorin (C, D) (% positively stained area) in bronchial and transbronchial biopsies from controls and patients with controlled and uncontrolled asthma. Data are presented as scatter dot plots where horizontal line denotes median value. Representative micrographs of double staining of versican (brown) and decorin (red) from controls (E, H) and patients with controlled asthma (F, I) and uncontrolled asthma (G, J) in bronchial (E-G) and transbronchial (H-J) biopsies. Scale bars: F, G = 50 μm, E, I and J = 100 μm, H = 200 μm.