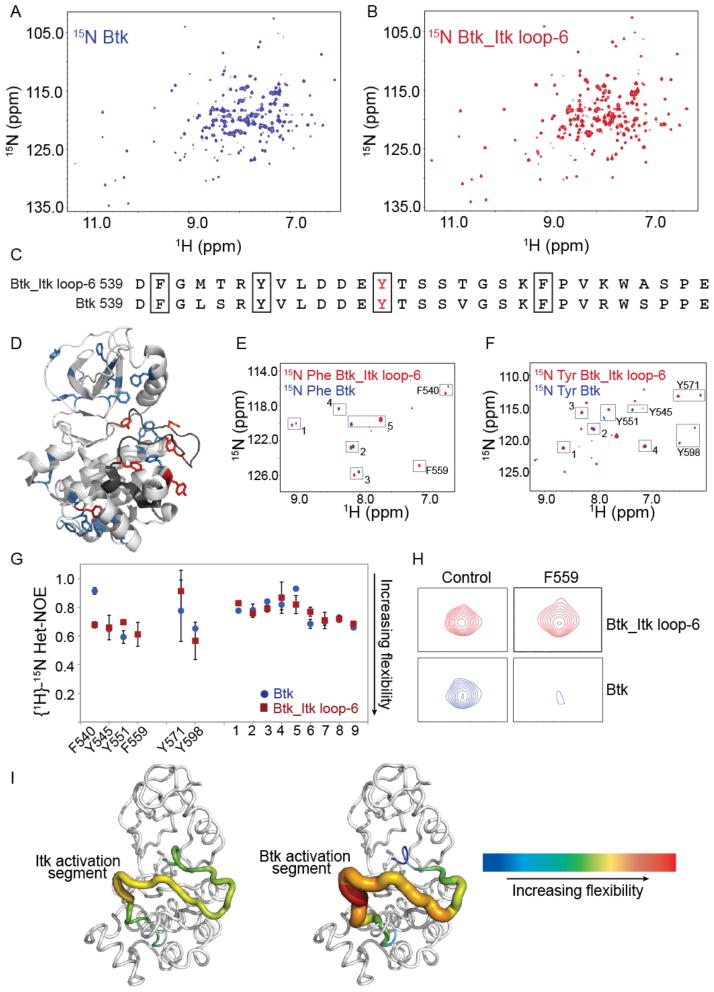
Fig. 6. The C-terminus of the kinase activation segment of Btk is more dynamic than that of Itk.
(A and B) Comparison of the 1H-15N TROSY HSQC spectra of the uniformly 15N labeled (A) kinase domain of WT Btk and (B) kinase domain of the Btk_Itk loop-6 mutant. Data is representative of at least three independent experiments. (C) Comparison of the sequences of the activation segments of WT Btk and the Btk_Itk loop-6 mutant. (D) Structure of the kinase domain of Btk (PDB: 1K2P) showing the tyrosine and phenylalanine residues throughout the protein. Six tyrosine and phenylalanine backbone amide resonances have been assigned (shown in red), whereas the remainder of the tyrosines and phenylalanines (in blue) have not been assigned. (E and F) 1H-15N TROSY HSQC spectra for the kinase domains of WT Btk and the Btk_Itk loop-6 mutant specifically labeled with (E) 15N-Phe and (F) 15N-Tyr. Peaks that were assigned are labeled, and the unassigned peaks in the spectra that correspond to either phenylalanine or tyrosine resonances are numbered. (G) Steady-state {1H}-15N heteronuclear NOE data for WT Btk (blue circles) and the Btk_Itk loop-6 mutant (red squares) are plotted for assigned and unassigned tyrosines and phenylalanines. F540, Y545, Y551, and F559 reside in the activation loop segment of each kinase. (H) Btk F559 shows extensive line broadening in the context of WT Btk as compared to the Btk_Itk loop-6 mutant. (I) Dynamical differences based on Het-NOE values for the activation loop segments of Itk (left) and Btk (right) are plotted onto the structure of WT Btk (PDB: 1K2P). Increasing flexibility is indicated by the color and width of the structural trace.

