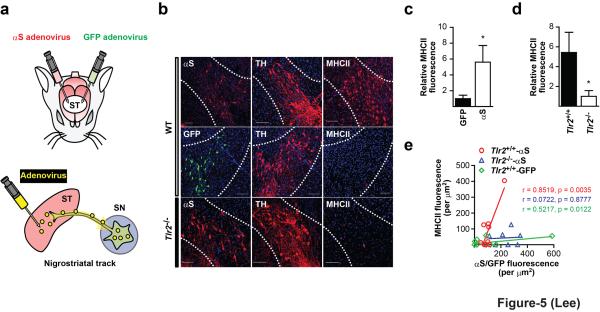
Figure 5.
TLR2-dependent microglial activation by α-synuclein overexpression in nigral dopaminergic neurons. (a) Experimental scheme. (b) Immunofluorescence images of the SN (dotted lines). Scale bars: 100 μm (c) MHC II fluorescence in the SN of wild type mice that received striatal injections of viral vectors expressing GFP and α-synuclein (n = 5). (d) MHC II fluorescence in the SN of wild type and Tlr2-/- mice after striatal injections of α-synuclein vectors (n = 5). (e) Correlation between MHC II and GFP/α-synuclein fluorescence in SN (WT; n = 9, Tlr2-/-; n = 7, GFP; n = 12). MHC II fluorescence data (c,d) were analyzed using the Mann-Whitney U test. Error bars represent ± s.e.m. *P < 0.05. “n” represents the number of animals.

