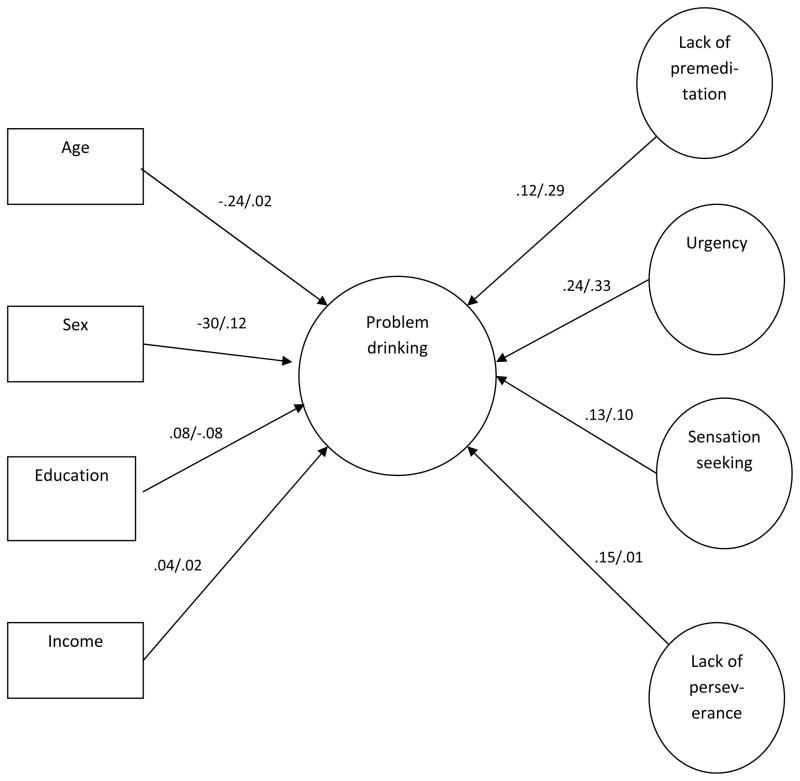
Figure 1.
Summary of the concurrent predictive relationships between demographic, the four scales of the UPPS-R and problem drinking. Each scale’s influence is corrected for its overlap with the other scales. For each relationship, the first number represents the beta weight for the First Nation group and the second number represents the beta weight for the Caucasians.

