
Figure 1.
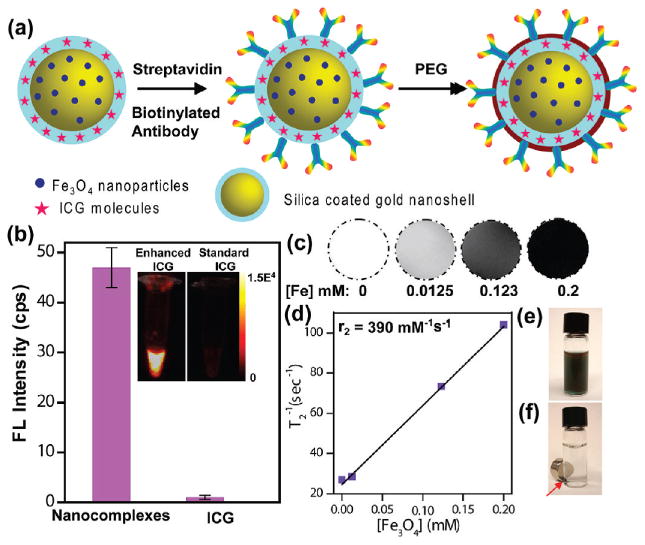
Characterization of multifunctional nanocomplexes. (a) Schematic representation of antibody and PEG conjugation to nanocomplexes. (b) Fluorescence (FL) intensity of nanocomplexes at 830 nm compared with standard unenhanced ICG showing ∼50-fold enhancement by nanocomplexes. Inset: Near-IR FL image of vials with enhanced ICG (nanocomplexes) and standard ICG of equivalent concentration. (c) T2-weighted MR images of nanocomplexes in aqueous media at various concentrations. The [Fe] concentration in each sample is provided at the bottom of the respective images. (d) Spin-spin relaxation rate (T2−1) as a function of [Fe] of the nanocomplexes. Optical image of nanocomplexes (e) dispersed in aqueous media and (f) with magnet (shown with arrow).