
Figure 2.
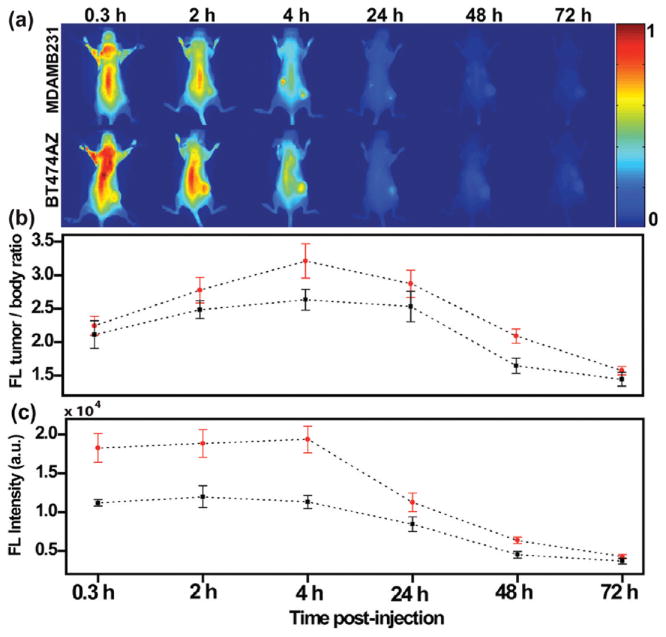
Nanocomplexes delivery in vivo imaged via NIR-FOI (a) NIR images of mice with HER2 low expressing MDAMB231 xenografts (top) and HER2 overexpressing BT474AZ xenografts (bottom) at 0.3, 2, 4, 24, 48, and 72 h postinjection of nanocomplexes. (b) Fluorescence (FL) intensity of tumor-to-body ratio at different time points of mice with BT474AZ xenografts (n = 6) and MDAMB231 xenografts (n = 3) and showing maximum fluorescence at 4 h. Significant variation across tumor types, p = 0.007, determined by ANOVA is observed. (c) Fluorescence intensity comparison of tumors only between BT474AZ (n = 6) and MDAMB231 (n = 3) showing 71.5% increase in signal at 4 h in BT474AZ tumors compared to MDAMB231 tumors, p = 0.003 across tumor types. The dotted lines have been provided as guide to the eye.