
Figure 3.
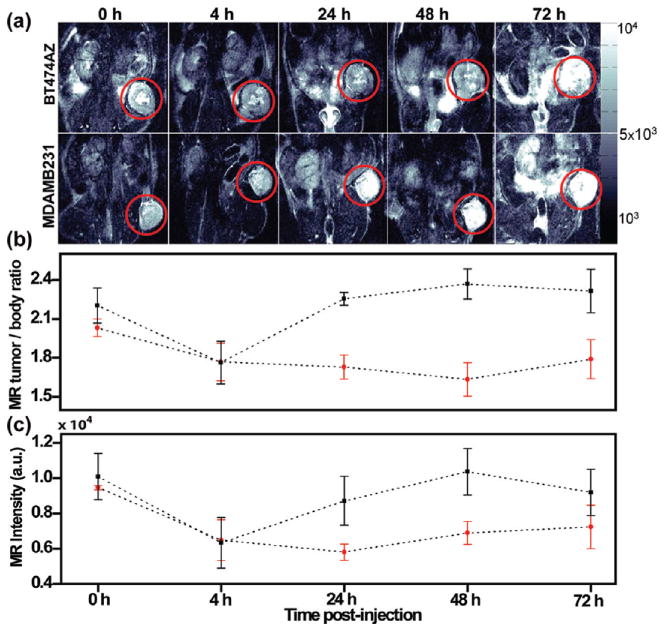
Monitoring uptake of nanocomplexes in vivo via MRI. (a) T2-weighted MR images of mice with HER2 overexpressing, BT474AZ, xenografts (top) and HER2 low expressing, MDAMB231, xenografts (bottom) preinjection, 0 h, and 4, 24, 48, and 72 h postinjection of nanocomplexes. The tumor is shown in red circle. (b) MR image intensity of tumor-to-body ratio at different time points of mice with BT474AZ xenografts (n = 3) and MDAMB231 xenografts (n = 3) and showing T2-weighted contrast for BT474AZ even at 72 h. Significant variation across tumor types, p = 0.002, determined by ANOVA is observed. (c) MR image intensity comparison of tumors only between BT474AZ (n = 3) and MDAMB231 (n = 3) showing 50.5% darker contrast at 24 h in BT474AZ tumors compared to MDAMB231 tumors, p = 0.038.