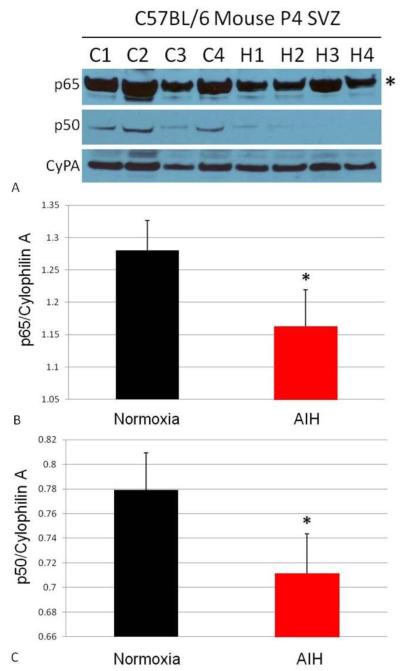
Figure 4. In vivo AIH affects NF-κß signaling.
The same tissue from Fig. 3 was also interrogated for NF-κß protein expression via Western blot (A). C1-C4 indicates replicates of control (normoxic) animals; H1-H4 indicates replicates of AIH-treated animals. Expression of the NF-κß p65 subunit (A, top panel, band indicated with asterisk; quantitated in B) and p50 subunit (A, middle panel, quantitated in C) were downregulated in SVZ tissue immediately following AIH. In panels B and C the “*” indicates p<0.05 vs. normoxia tissues. Densitometry results are expressed as a ratio of the protein of interest to Cyclophilin A.

