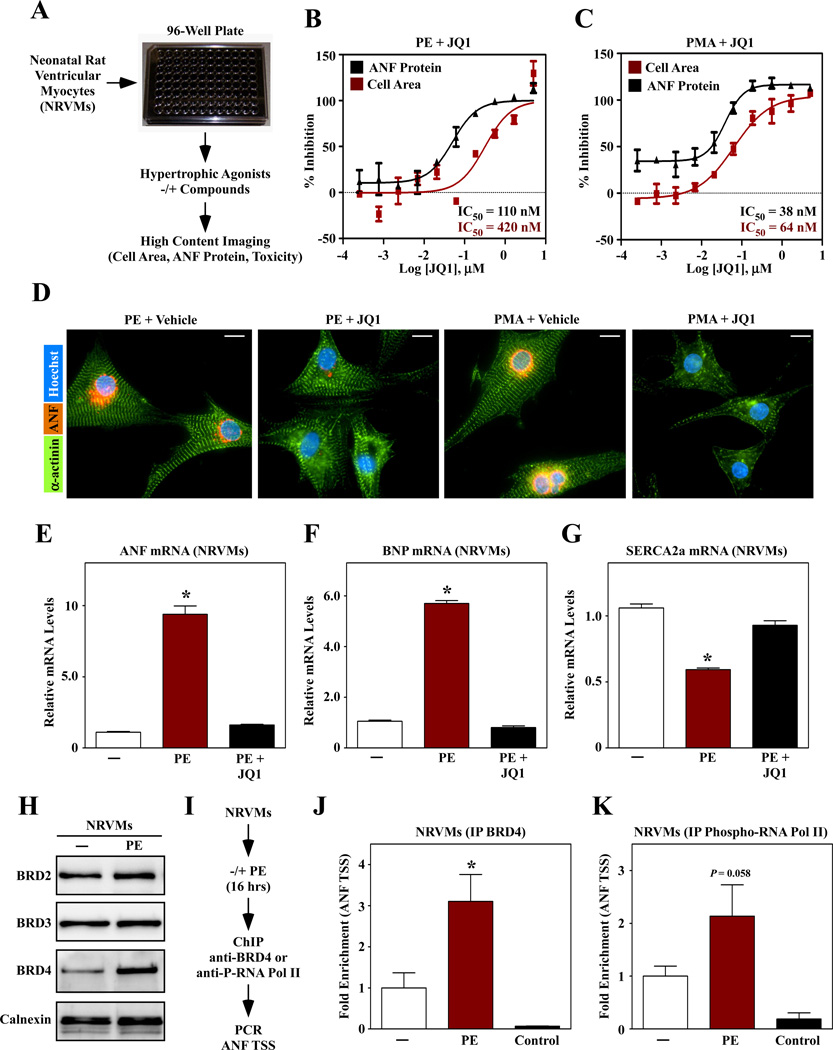
Fig. 1.
A small molecule BET protein inhibitor blocks cardiac hypertrophy. (A) A high throughput assay of cardiomyocyte hypertrophy based on culture of primary neonatal rat ventricular myocytes (NRVMs) on 96-well plates and high content imaging to quantify cell size and expression of atrial natriuretic factor (ANF) protein as a biomarker of pathological cardiac hypertrophy. (B, C) A hit compound, JQ1, dose-dependently blocked hypertrophy in response to treatment with phenylephrine (PE; 10 µM) or phorbol myristate acetate (PMA; 50 nM). (D) Images of ANF and α-actinin staining in NRVMs treated with agonists in the absence or presence of JQ1 (1 µM). Scale bar = 10 µm. (E – G) NRVMs were stimulated for 48 hrs with PE in the absence or presence of JQ1 and quantitative PCR was performed to assess expression of ANF, brain natriuretic peptide (BNP) and sarcoendoplasmic reticulum Ca2+ ATPase 2a (SERCA2a). N = 3 plates of cells per condition; *P<0.05 vs. unstimulated controls. (H) Immunoblot analysis of BET proteins in NRVMs treated with PE for 48 hrs. Calnexin is a loading control. (I) Chromatin immunoprecipitation (ChIP) strategy. (J, K) BRD4 and phospho-RNA Pol II association with the ANF transcription start site. IP with normal IgG was used as a negative control. N = 3 plates of cells per condition (4 pooled plates per N); *P<0.05 vs. unstimulated controls.

