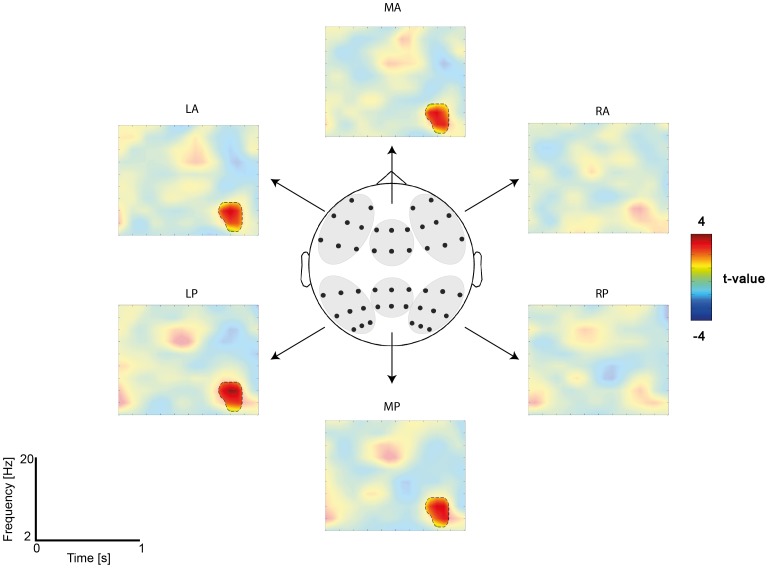
Figure 5. Time-frequency plots for each of the 6 ROI.
The ROI were middle anterior (MA), left anterior (LA), right anterior (RA), middle posterior (MP), left posterior (LP), and right posterior (RP) electrodes. Time-frequency representations depict the statistical difference in t-values for the target word in the CM versus MS feature context. The contours indicate the peak of the cluster-corrected statistical difference (p = .002).

