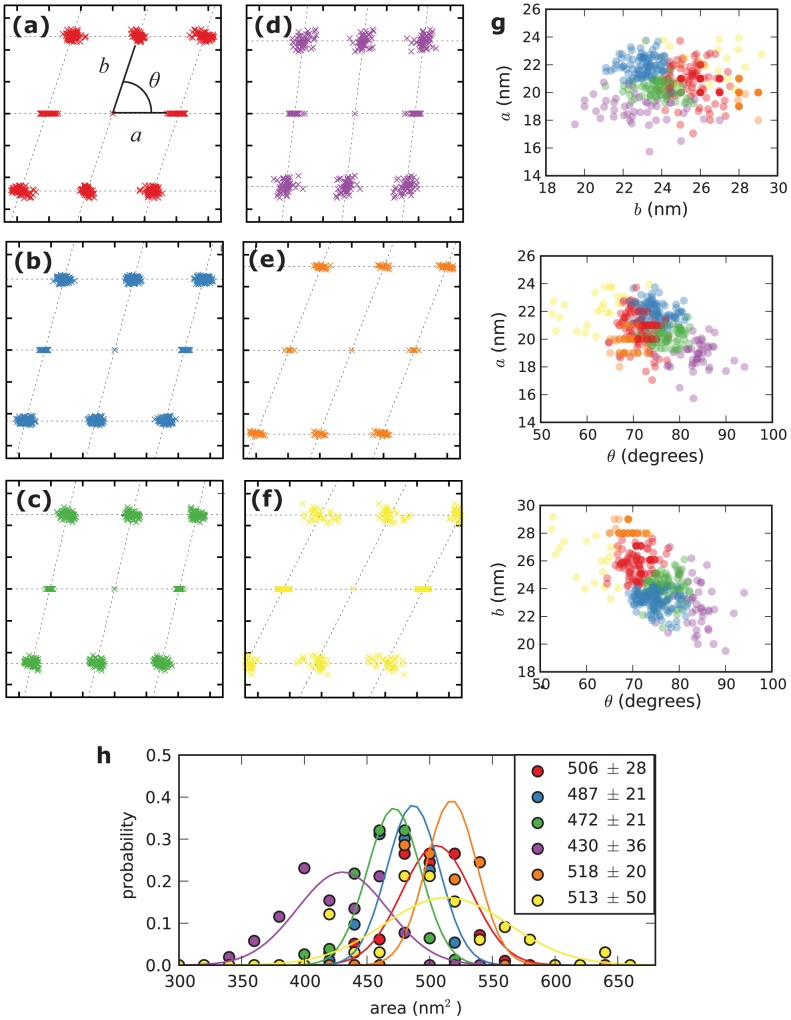
Figure 2. Results of cluster analysis of unit cells in the training data set.
(a)–(f): Fitted Bravais lattices for each particle in the training set, grouped by Gaussian mixture model (GMM) component. The a vector of each unit cell lattice is aligned with the horizontal axis. Tick marks are spaced 10 nm apart. Panel (a) illustrates the unit cell conventions used throughout this work. g: Two-dimensional views of the three-dimensional (a, b, ϑ) data points in the training set, colored by GMM component. h: Histograms of unit cell area (area = ab sin ϑ), grouped by GMM component. Values in legend are means±s.d. in square nanometers; lines are normal distributions with these means and standard deviations.

