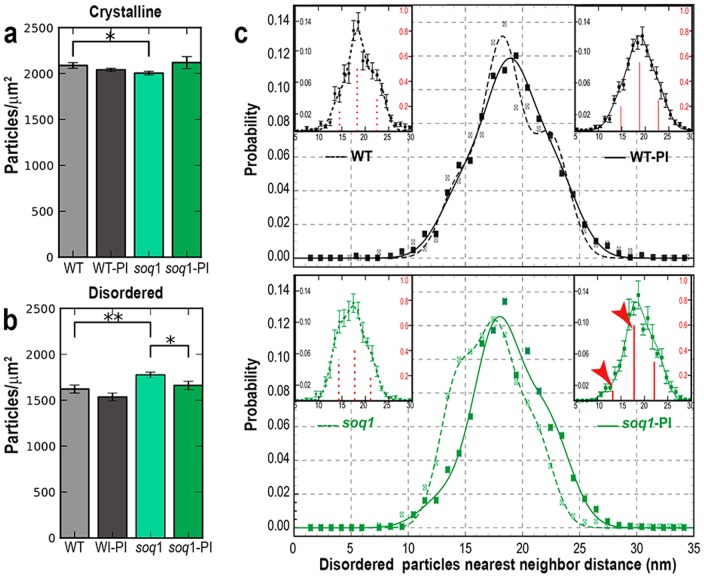
Figure 6. Particle number density and spatial correlations.
Particle density in (a) crystalline, and (b) disordered regions. Bars and error bars are means and SEM, respectively, from each experimental condition (N = 5–28 micrographs). All p-values are from Welch's t-test; * indicates p<0.05, and ** p<0.01. (c) Nearest-neighbor distance distributions of disordered complexes in WT, WT-PI (black lines), soq1, and soq1-PI (green lines). Symbols represent mean nearest-neighbor distance from experimental data. Lines are best multi-Gaussian fits to the data; WT (dashed black), WT-PI (solid black), soq1 (dashed green), and soq1-PI (solid green). Insets display individual NNDF means and SEM error bars with Gaussian centers and weights indicated by the red spikes (right axes); red arrowheads indicate significant changes in distance distribution upon illumination.

