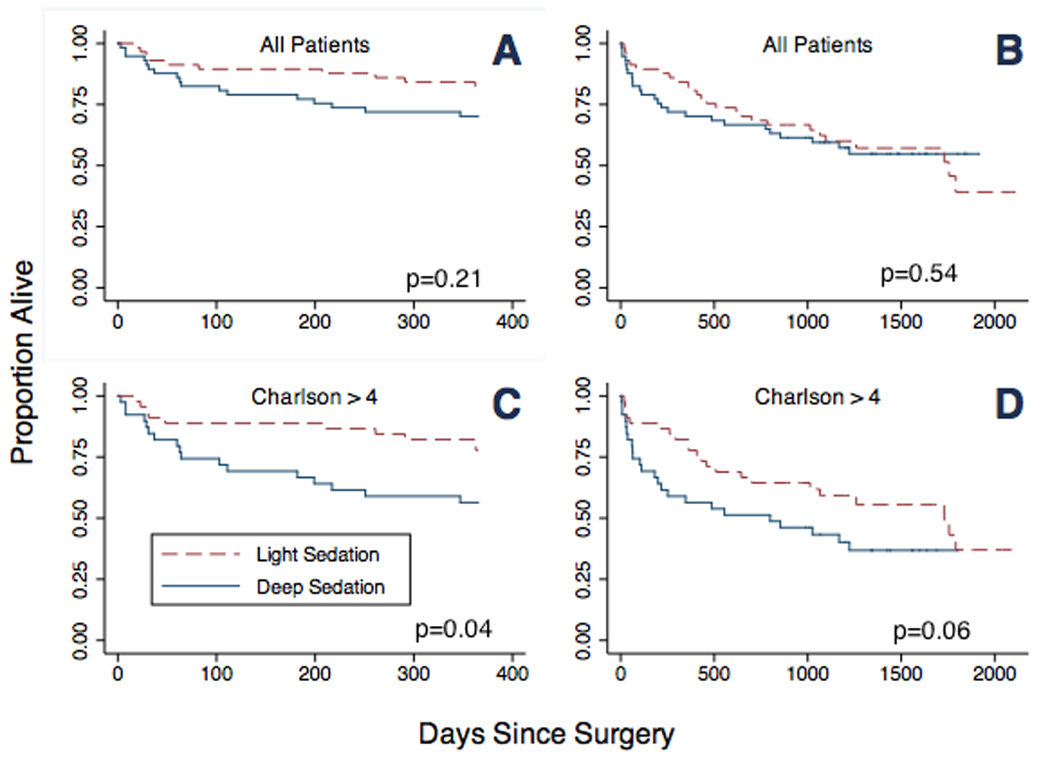
Figure 1.

Kaplan-Meier survival curves (1-year and overall) for all patients and for patients with Charlson score >4. Survival of all patients (A) and patients with Charlson score >4 (C) at 1 year. Survival of all patients (B) and patients with Charlson score >4 (D) in overall follow-up. (P values for 1-year mortality are given by adjusted Cox proportional hazards models, and P values for overall mortality are given by adjusted parametric models)
