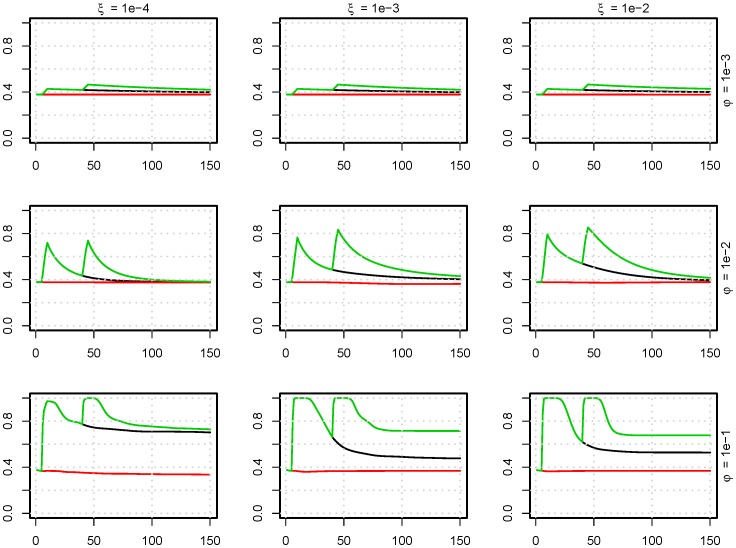
Figure 6. The influence of AMT on the level of resistant strains.
Fraction of antimicrobial resistant bacteria (y-axes) as a function of time [days] (x-axes) with antimicrobial treatment. The time of AMT is indicated by color: red: no treatment, black: treatment from day 5 to 10, green: additional treatment day 35 to 40. This is modelled for nine parameter sets of  (excretion rate) and
  (uptake fraction from the environment). (
 ).
).

