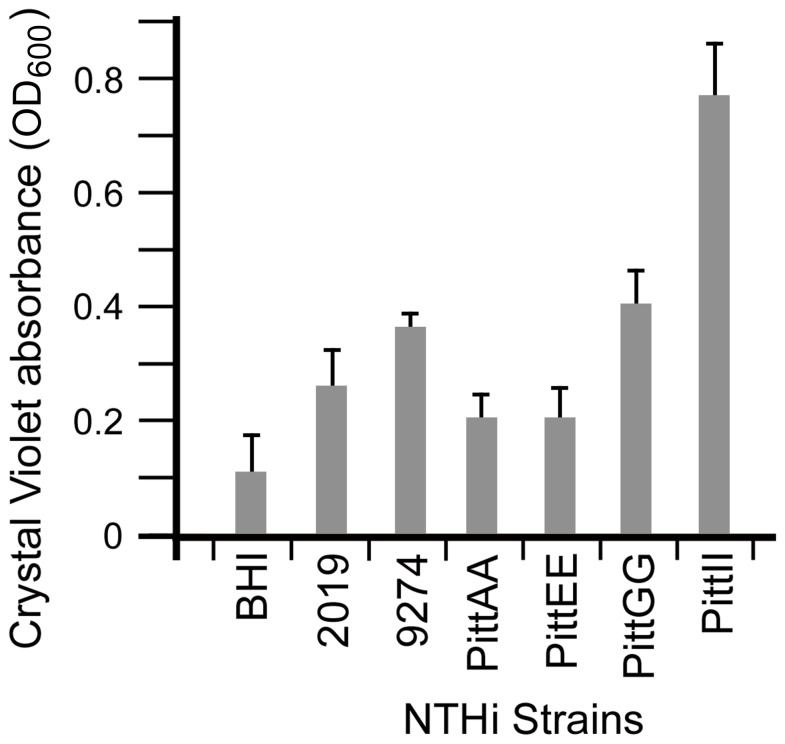
Figure 1. Biofilm formation is variable between NTHi strains.
Biofilm quantification using crystal violet assay showed the variability in biofilm formation between the NTHi strains in this study. Relative Biofilm Quantity was measured as OD600 of crystal violet in DMSO; higher absorbance indicated more biofilm production. The PittAA and PittEE strains showed the least amount of biofilm attachment to the growth surface while PittII showed the most. The other three strains (2019, 9274 and PittGG) formed intermediate amounts of biofilm material (t-test analysis in Table S2).

