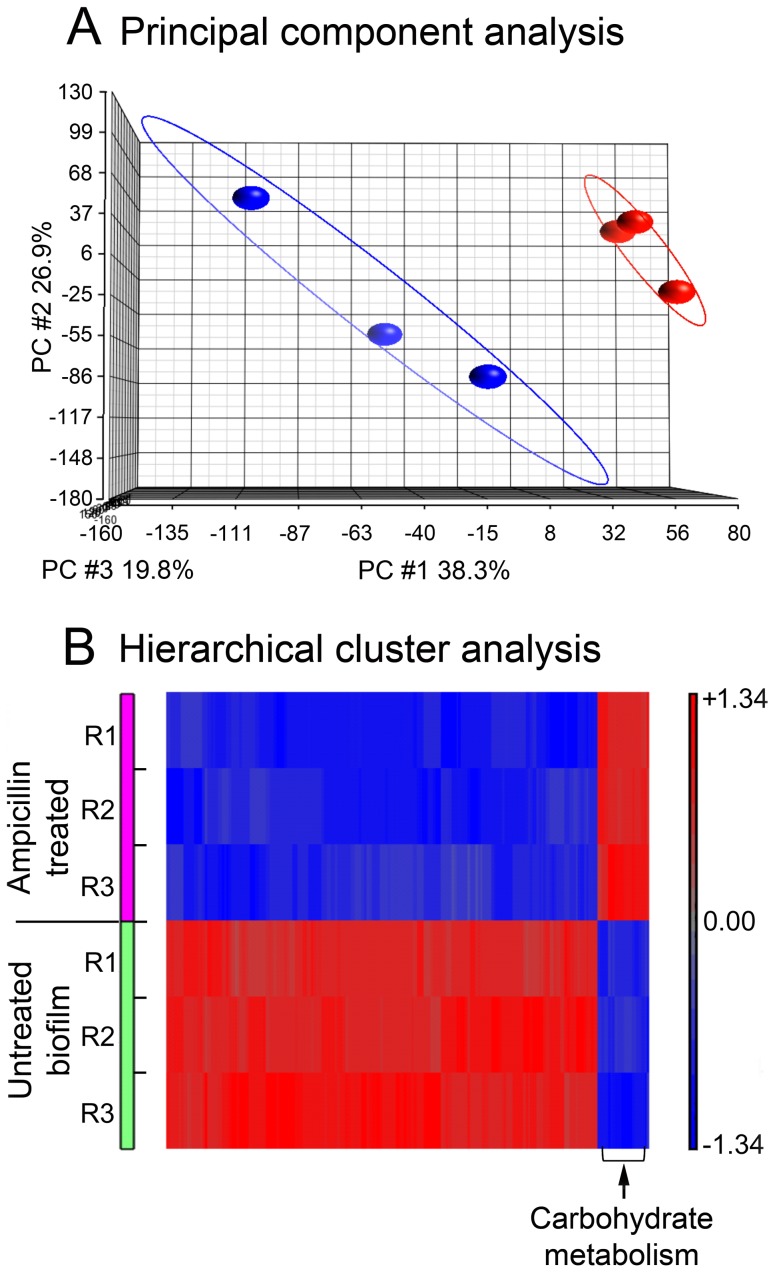
Figure 8. mRNA analysis of PittGG biofilms.
A. Principal component analysis of microarray gene expression of the PittGG biofilm bacteria (NTHi) exposed to 170 ng/mL ampicillin. The major variations (PC1, PC2, and PC3) are visualized in 3-dimensions. The three PCs together accounted for about 85% of the variations present in the entire data set. A distinguishable grouping difference can be seen between ampicillin treated (in blue) and non-treated (in red) samples. B. Hierarchical cluster of significantly differentially expressed genes in the PittGG biofilm bacteria (NTHi) treated with 170 ng/mL ampicillin. Heatmap visualization of 59 significantly regulated genes by ampicillin treatment. Results from the 3 replicate experiments (R1, R2 and R3) of ampicillin-treated and untreated biofilms are presented. A hierarchical clustering was analysed on the probe sets representing the 59 genes including 8 up and 51 down regulated gene transcripts with filter criteria of at least 1.5 folds change plus P≤0.05 and FDR less than 0.05. Rows: samples; columns: genes. The up-regulated genes relating to carbohydrate metabolism are indicated.

