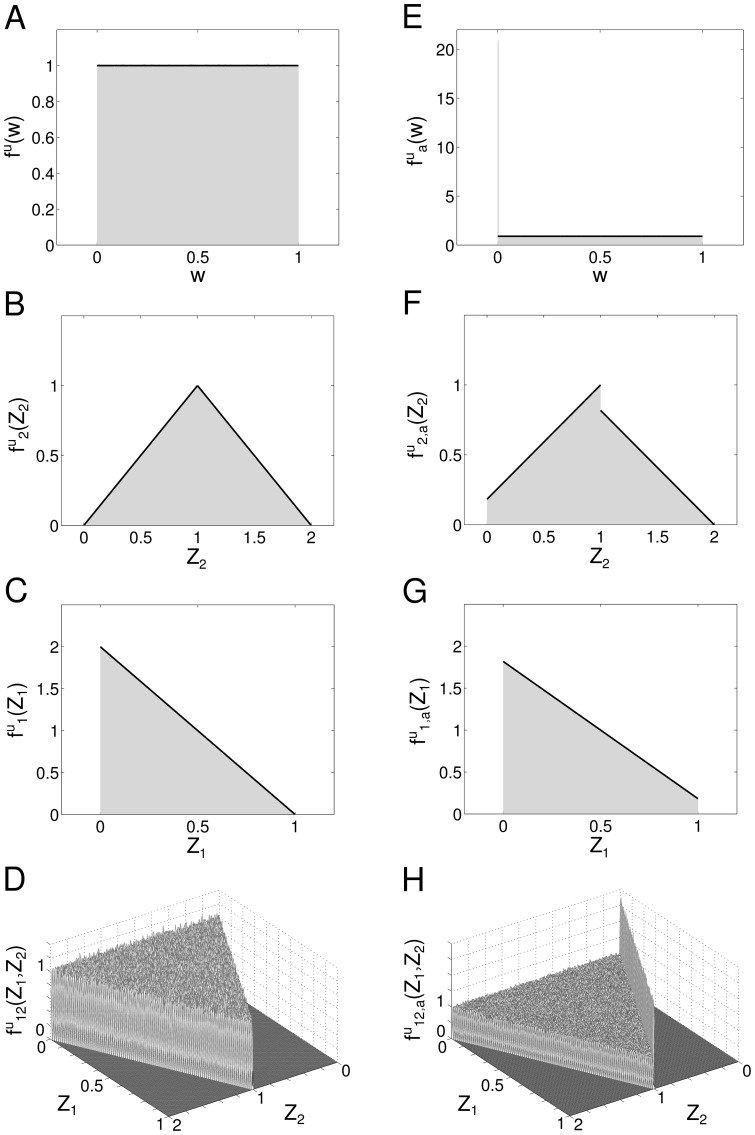
Figure 1. Probability density functions for the case of uniformly distributed connections.
A Distribution of the uniform variable  B Distribution of the sum
  of two uniform variables. C Distribution of the absolute difference
  of two uniform variables. D Joint distribution of
  and
and  E, F, G The same as A, B and C but with pruning
  H The same as D but with pruning
  In all figures, Grey shaded area: histograms from simulations, Black lines and surfaces: theoretical results (see Eq. (7)–(13)).

