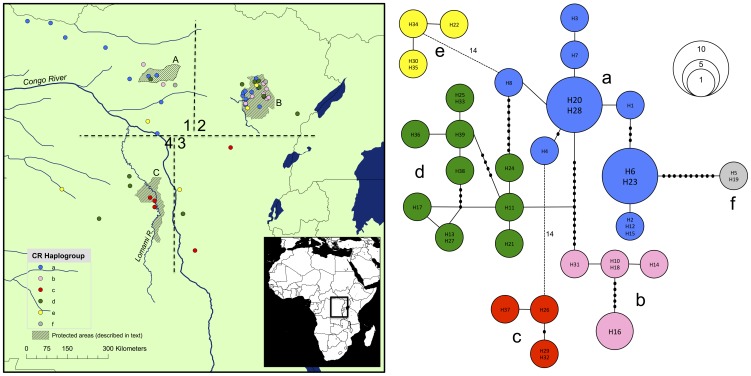
Figure 1. Okapi samples used in the present study, with the colour relating to the adjacent network [30], based on 833 bp of mitochondrial DNA.
For the network, TCS connected alleles with a 95% confidence limit, those that did not fall within that limit are connected with dotted lines (with numbers corresponding to the number of mutations). Haplotypes are grouped into haplogroups (number of mutations within always less than between a haplogroup) by colour. Some haplotypes contain more than one label due to different programs using missing data in different ways. Sampling locations are arbitrarily labelled 1–4 for reference in the text. Key protected areas are labelled A (Rubi-Tele Hunting Reserve), B (Okapi Faunal Reserve, RFO), C (Lomami National Park), D (Lomami River).

