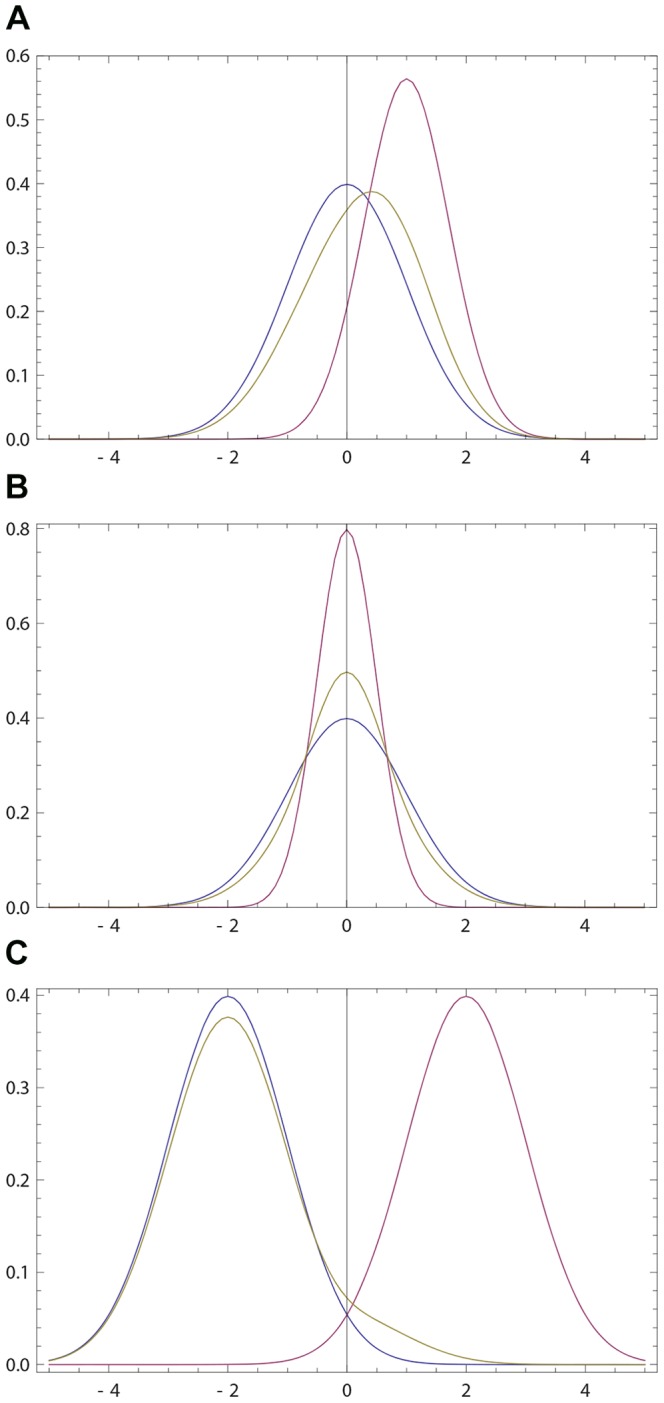
Figure 1. Opinions described via Gaussian densities (17).

The initial opinion of  is described by Gaussian probability density p(x) (blue curve) centered at zero; see (17). The opinion of
  amounts to Gaussian probability density q(x) (purple curve) centered at a positive value. For all three figures continuous density f(x) (
 ) were approximated by 100 points
  ,
,  . The resulting opinion
  of
of  is given by (16) with
  (olive curve). (a) The opinion of
  moves towards that of
  ;
;  ,
,  ,
,  ,
,  . (b) The maximally probable opinion of
  is reinforced;
  ,
,  ,
,  ,
,  . (c) The change of the opinion of
  is relatively small provided that the Gaussian densities overlap only in the region of non-commitment; cf. (18), (19). Whenever the densities overlap only within the rejection range the difference between p(x) and
  is not visible by eyes. For example, if p(x) and q(x) are Gaussian with, respectively,
  ,
,  ,
,  , the Hellinger distance (see (30) for definition)
  is close to maximally far, while the opinion change is small:
  .
.
