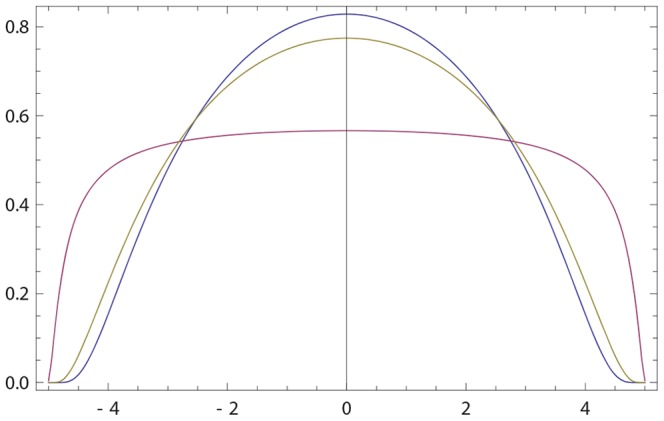
Figure 2. Opinions described via bump densities (28).

Blue curve: the initial opinion of  given by (28) with b = 1. Purple curve: the opinion of
  described by (28) with
  . Olive curve: the resulting opinion of
  obtained via (16) with
  .
.

Blue curve: the initial opinion of  given by (28) with b = 1. Purple curve: the opinion of
  described by (28) with
  . Olive curve: the resulting opinion of
  obtained via (16) with
  .
.