
Figure 3. Opinion change versus discrepancy.
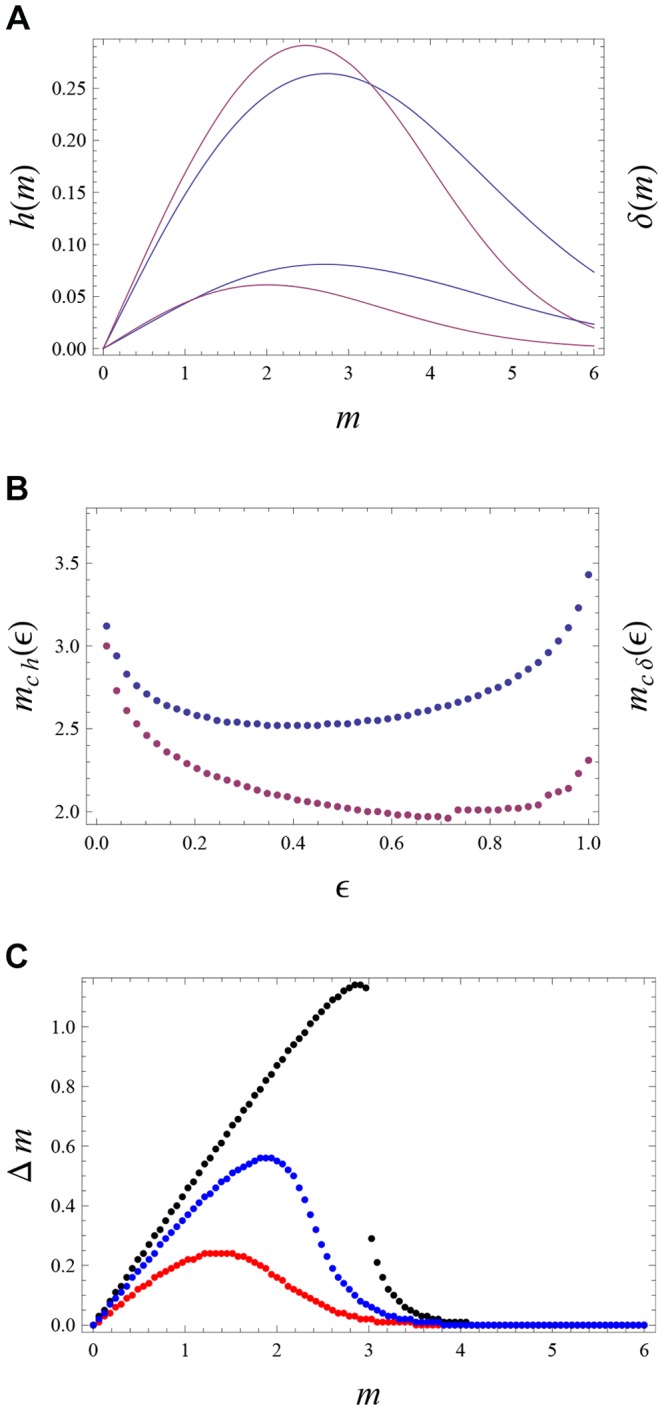
(a) The opinion change is quantified via the Hellinger distance  between the old and new opinion of
  (blue curves); see (30) for the definition. For comparison we also include the total variance distance
  (purple curves); see (33). These two distances are plotted versus the discrepancy
  . The initial opinion of the agent
  is Gaussian with
  and
and  ; see (17). The opinion of
  is Gaussian with
  and
and  . Thus m quantifies the initial distance between the opinions of
  and
and  . The final opinion
  is given by (13). Different curves correspond to different
  . Blue curves:
  for
for  (upper curve) and
  (lower curve). Purple curves:
  for
for  (upper curve) and
  (lower curve). The maximum of h(m) (
 ) is reached at
  (
( ). (b)
  (
( ) is the point where h(m) (
 ) achieves its maximum as a function of m. Blues points:
  versus
  for same parameters as in (a).
  grows both for
  and
and  , e.g.
 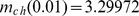 ,
,  ,
,  ,
,  . Purple points:
  versus
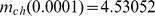
  for same parameters as in (a). (c) The difference of the anchors (maximally probable values)
  versus
  for the initial opinions of
  and
and  given by (17) under
  ,
,  ,
,  and
and  . The final opinion
  of
of  (and its maximally probable value
  ) if found from (13) under
  (black points),
  (blue points) and
  (red points).