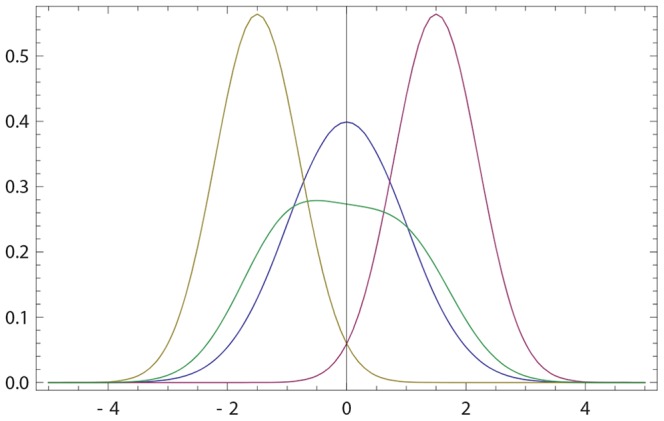
Figure 4. Order of presentation effect.

Blue curve: The initial opinion of  is described by Gaussian probability density p(x) with
  and
and  ; see (17). Purple (resp. olive) curve: the initial opinion of
  (resp.
  ) are given by (17) with
  (resp.
  ) and
) and  (resp.
  ). Green curve: the resulting opinion of
  after interacting first with
  and then with
  . Both interactions use
  . The final opinion of
  is inclined to the most recent opinion (that of
  ) both with respect to its maximally probable value and distance. The final opinion of
  has a larger width than the initial one.
