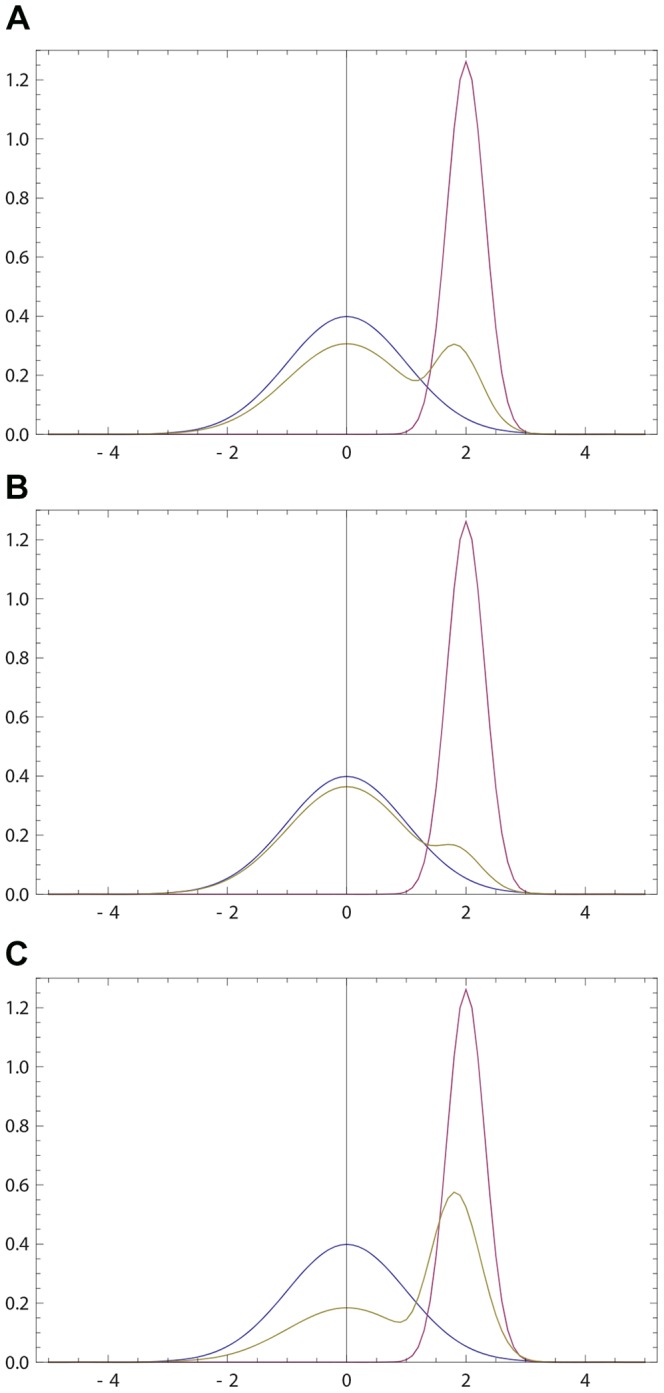
Figure 5. Cognitive dissonance.

(a) Blue (resp. purple) curve: the initial opinion of agent  (resp.
  ) described by probability density p(x) (resp. q(x)). Olive curve: the final opinion
  of
of  as given by (16) with
  . Here p(x) and q(x) are defined by (17) with
  ,
,  ,
,  ,
,  . The final opinion develops two peaks of comparable height (cognitive dissonance). (b) Avoiding the cognitive dissonance due to a larger
  : the second peak is much smaller (other parameters are those of (a)). (c) Avoiding the cognitive dissonance due to a smaller
  : the first peak is much smaller (other parameters are those of (a)).
