
Figure 6. Opinion change in the boomerang regime.
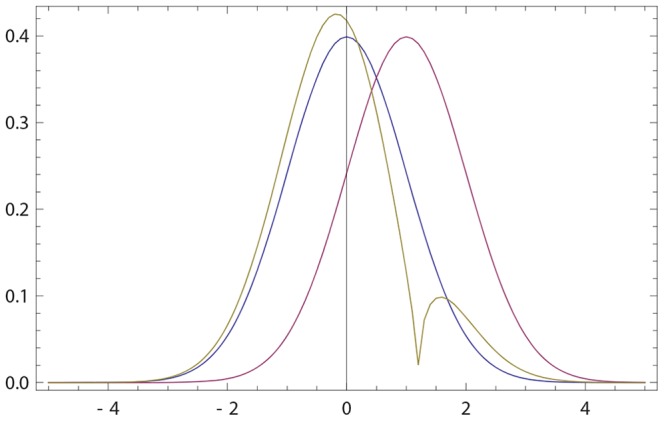
Blue (resp. purple) curve: the initial opinion of agent  (resp.
  ) described by probability density p(x) (resp. q(x)). Olive curve: the final opinion
  of
of  given by (16) with
  . Here p(x) and q(x) are given by (17) with
  and
and  . The anchor (maximally probable opinion) of
  not only moves away from the anchor of
  ; but it is also enhanced: the (biggest) peak of
  is larger than that of p(x). The second (smaller) peak of
  arises because the initial probability of
  located to the right from the anchor
  of
of  , moves away from
  ;
;  gets a local minimum close to
  .
.