
Figure 9. Repeated persuasion in the boomerang regime.
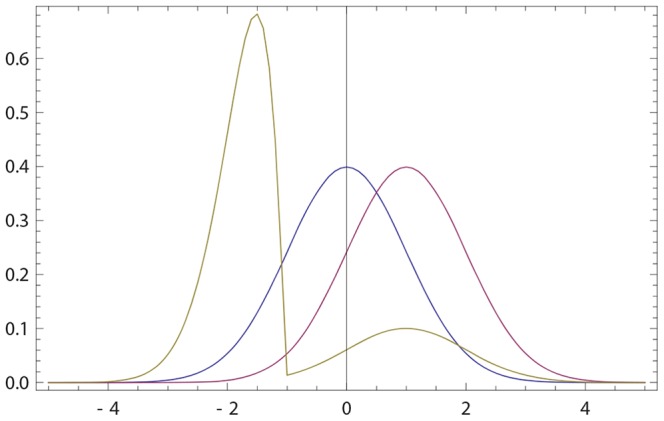
Blue (resp. purple) curve: the initial opinion of agent  (resp.
  ) described by probability density p(x) (resp. q(x)) as given by (17) with
  ,
,  ,
,  . Olive curve: the opinion of
  after 50 iterations (52) with
  .
.