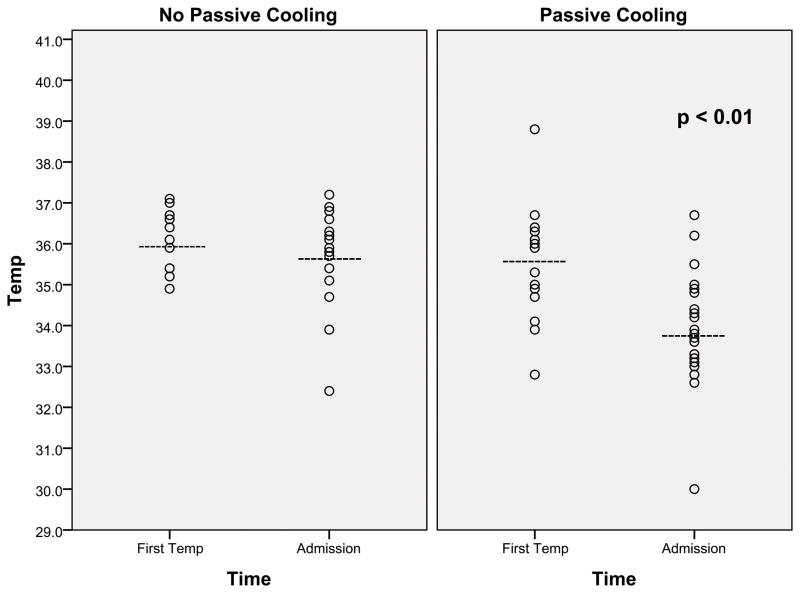
Figure 1.
Scatter plot showing temperature (°C) recorded after birth and on admission to CHB, before (n=16) and after (n=27) implementation of passive cooling during transport. The dashed lines indicate the mean temperature, and p<0.01 indicates significant difference in mean temperature on admission between cooled and non-cooled groups.

