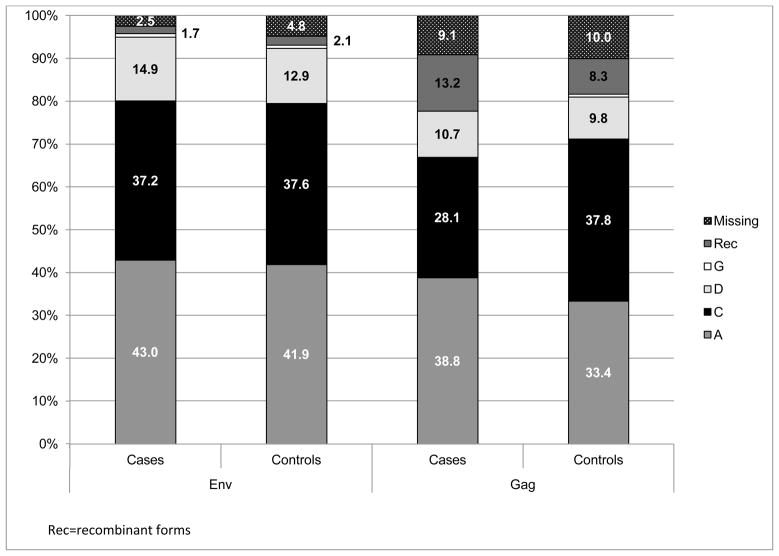
Figure 1. Distribution of env and gag subtype among cases and controls.
The percentage distribution of HIV-1 subtypes by cases (HIV-1 infected partner in transmitting couples, determined to be linked by viral sequencing) and controls (HIV-1 non-transmitting controls) for both the env and gag gene regions. Letters refer to the subtype for that gene region (RF=recombinant forms)

