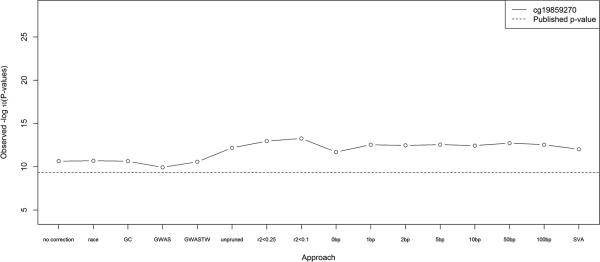
Figure 3. Replication of smoking results.
Replication of the top CpG site associated with smoking in [Breitling, et al. 2012; Breitling, et al. 2011; Shenker, et al. 2013; Sun, et al. 2013; Wan, et al. 2012], using 16 different approaches to adjust for population stratification. The dotted line indicates the p-value from a previous replication based on 239 African Americans from our sample [Sun, et al. 2013].

