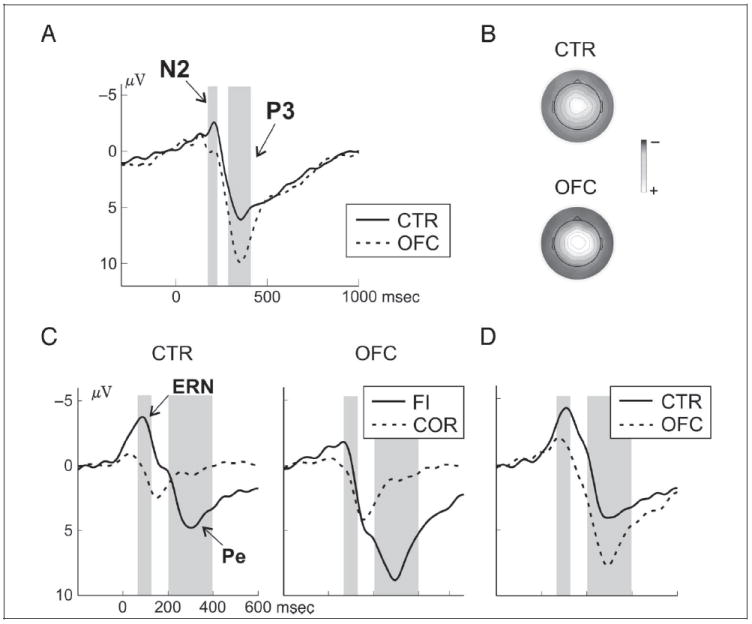
Figure 5.

ERP results for stop trials. (A) ERPs at the central midline cluster for patients and controls in successful (SI) inhibitions. The N2, larger in controls than patients, and the P3, larger in patients than controls, are highlighted with gray boxes. (B) The P3 topography (300–400 msec) for the two groups is shown with a color scale from 5 to −10 μV. (C) Response-locked ERPs at the central midline cluster in controls (left column) and patients (right column), separately for correct go trials (dashed lines) and failed inhibition trials (solid lines). The analyzed time windows for the ERN and the Pe are marked with gray boxes. (D) Difference waves (failed inhibition trials − correct go trials) highlighting the ERN and the Pe in the two groups.
