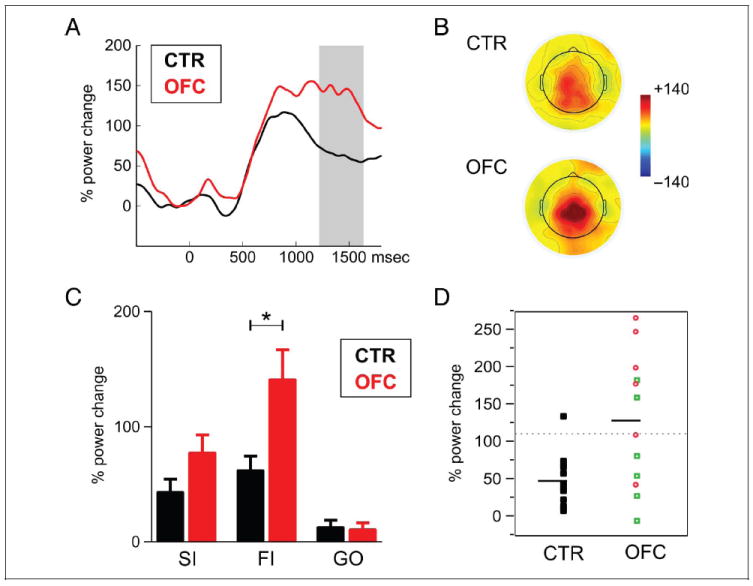
Figure 6.

Time–frequency results for stop trials. (A) Beta power (13–25 Hz) changes in failed inhibitions (FI), separately for controls (black) and patients (red). Both groups showed increased beta after errors, which was more pronounced and persistent in patients (time window of significant differences is indicated with gray box). (B) Shown is the topography of the beta increase (1250–1600 msec) for the two groups in FI trials. (C) Beta power change between 1250 and 1600 msec after the stop or go signal, separately for successful inhibition (SI), failed inhibition (FI), and go trial (GO) in controls (black) and patients (red). (D) Beta power change in FI for individual participants in the two groups. The dotted line indicates the point of significantly increased (p < .05) beta values compared with controls. Red circles denote patients whose lesion extended to BA 25/32, whereas green squares indicate patients whose lesion spared BA 25/32. The black horizontal line indicates the mean of the OFC patient and control groups.
