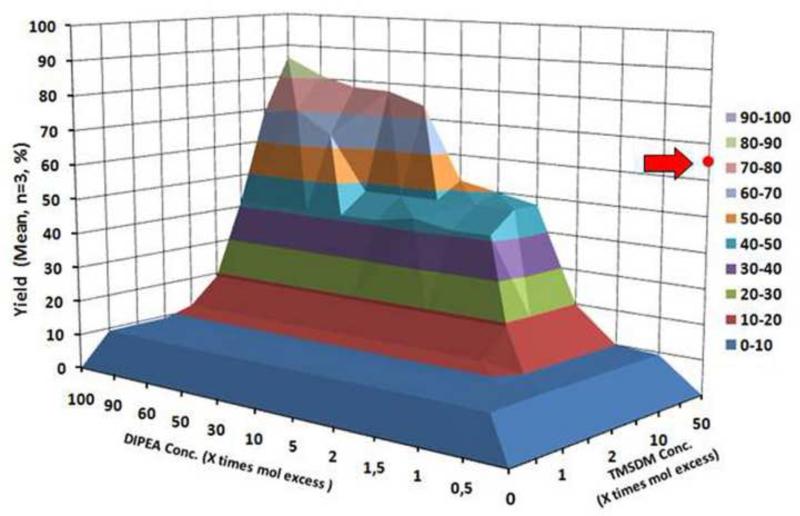
Figure 4.
Reaction optimization chart, with the DIPEA (base) mole excess plotted on the X axis and the TMS-DM (reagent) mole excess plotted on the Y axis. Yield represents mean of all six analytes measured 3 times individually. The red dot represents a derivatization of the same matrix with DM at 40 time excess and NO DIPEA. Both reaction were carried out in a real matrix (MeCN/MeOH (9:1) + denatured microsomal fraction extract). Standard deviation varies between 0.002 and 0.2.

