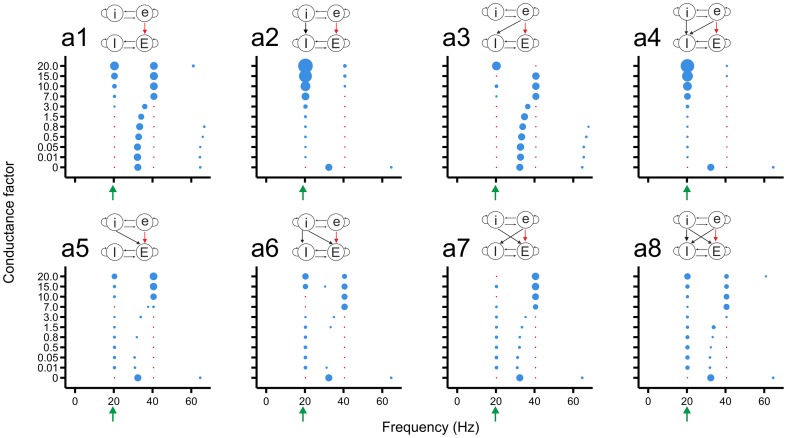
Figure 4. The eE connections from the slow to the fast network can impose the slow rhythm onto the fast network already at low connection strengths.
Lower case letters (e, i) label the excitatory and inhibitory populations in the slow network, and upper case letters those in the fast network (E, I). The strength (conductance factor) of the eE connections (red arrow in connection scheme) is varied in the different connectivity schemes. The blue discs indicate the oscillation frequencies in the fast network; their diameters depict the power. The red dots show the base frequency and the first harmonic of the slow network, without indicating power. The green arrow points to the base frequency of the slow network. In all connectivity schemes, for high eE connection strengths, the fast network became frequency locked to the rhythm of the slow network, at its base frequency and/or at the corresponding first harmonic. For lower connection strengths, the base frequency of the slow network and a frequency close to the base frequency of the fast network coexisted in the fast network (e.g., a7, a8).

