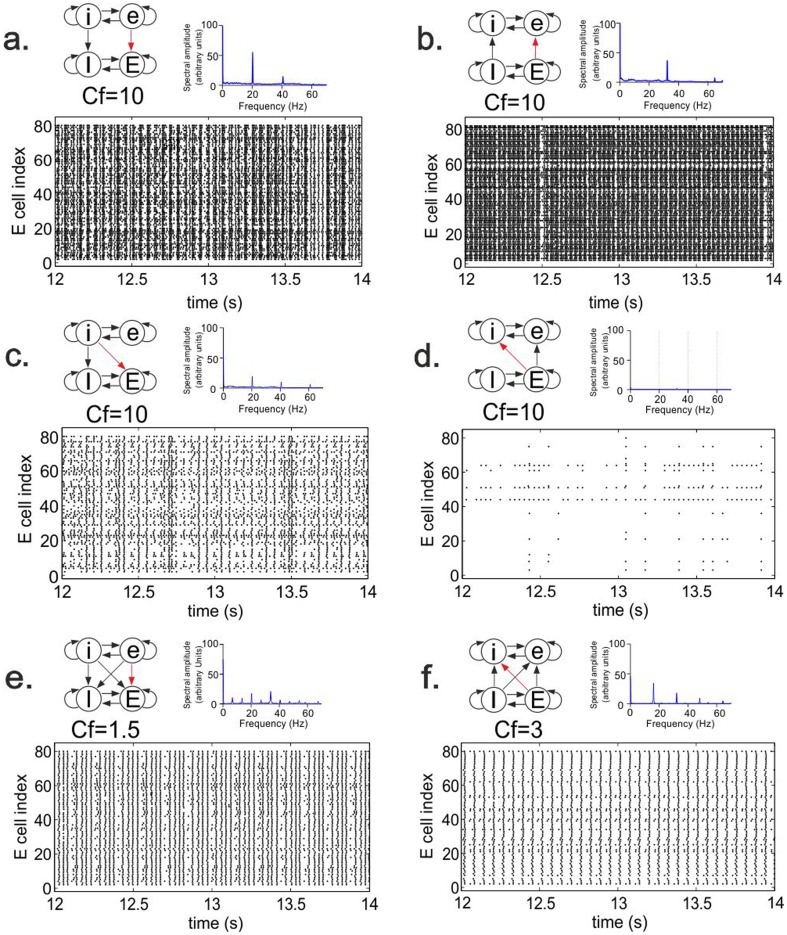
Figure 6. The effect of inter-network connections on firing pattern.
Shown are, for different connectivity schemes, the Fourier transform and the raster diagram of cell firing in the excitatory population of the target network. The conductance factor Cf indicates the relative strength of the red connection (see Methods). Panels a–f show connectivity schemes a2, A2, c2, B2, a8 and B8, respectively (see Fig. 2). In a–d, the source network completely imposed its rhythm onto the target network, whereas in e and f two different non-harmonic frequencies could coexist. In c and d, increased inhibition in the target network due to strong iE or Ei connections reduced the power of oscillatory activity in the target network.

