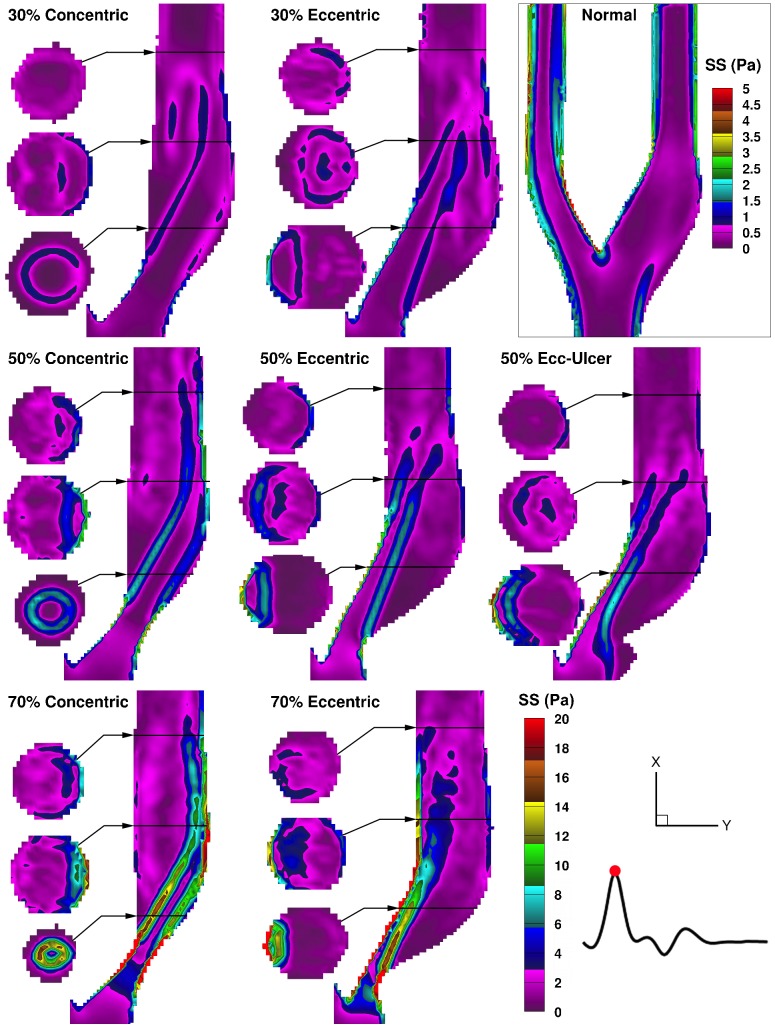
Figure 4. Color maps of the laminar (ensemble-averaged) shear stress shown for peak systole in the eight models.
Three cross-sectional slices are shown alongside the ICA lumen for the locations indicated (as described in Fig. 3). Note the bottom right color bar represents the seven stenosed models, and a separate color bar is used for the normal model as indicated in the enclosed box.

