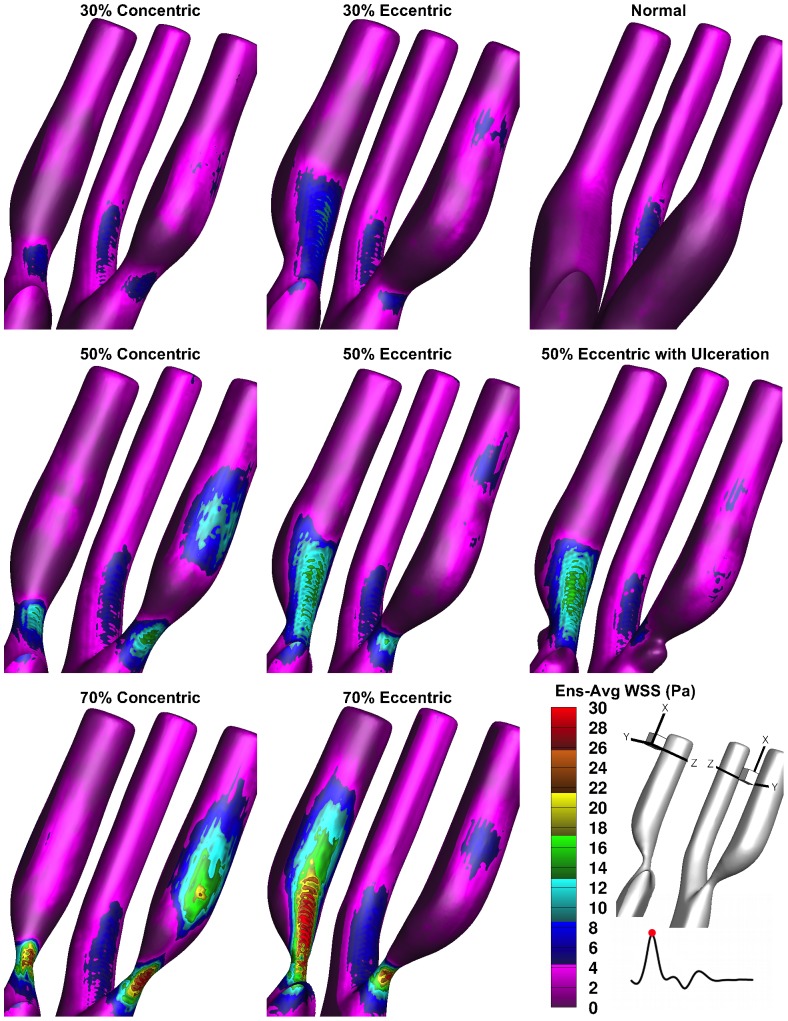
Figure 6. Ensemble-averaged wall shear stress shown for peak systole in the eight carotid models.
For optimal display, the ICA is shown from two different perspectives as indicated by the orientation schematic in the bottom right corner. The color bar represents all the models including the normal geometry. For improved accommodation, the dynamic range of the color bar is reduced to a maximum of 30%-stenosed models.

