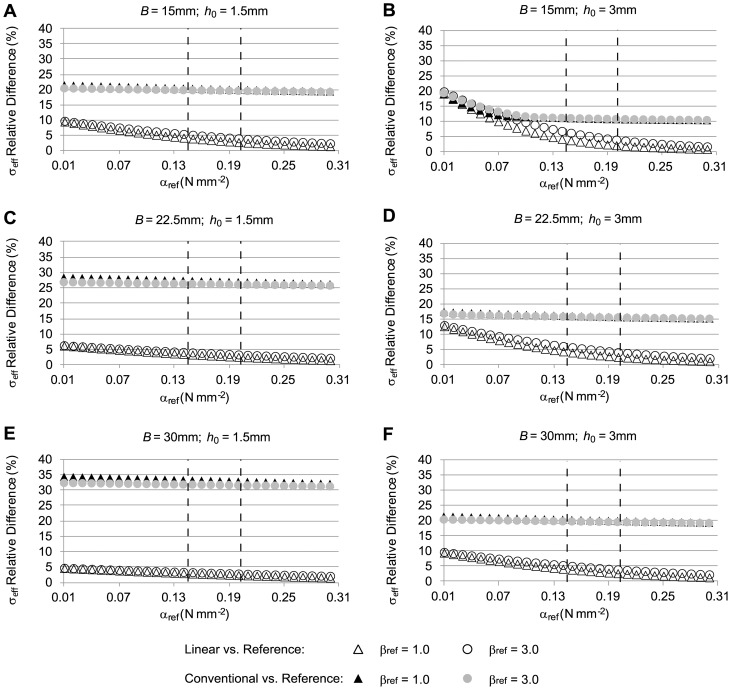
Figure 5. Relative differences in effective wall stress distributions for the case of a tubular arterial model.
The figure shows differences of effective wall stress distributions obtained from the conventional and linear models, with respect to the stress distributions from the reference model, computed using Eq. 33. To simulate the clinical situation where the material properties of the AAA are unknown, the material constants α and β (γ = 0) were varied in the reference model (αref and βref reported values), whereas population average α and β (α = 0.174 N/mm2, β = 1.881 N/mm2; RV material properties) were used in the conventional model, and constant elasticity (E = 8.4×10⁹ N/mm2) was used in the linear model. Further, the initial geometry was varied to represent different aneurysm sizes and wall thicknesses. In all cases, applied internal pressure was 0.016 N/mm2 (120 mmHg). Reported geometrical model external radius, B, and wall thickness, h0, correspond to the initial configuration of the reference model. The dashed lines indicate the physiological range of the material property values for αref.

