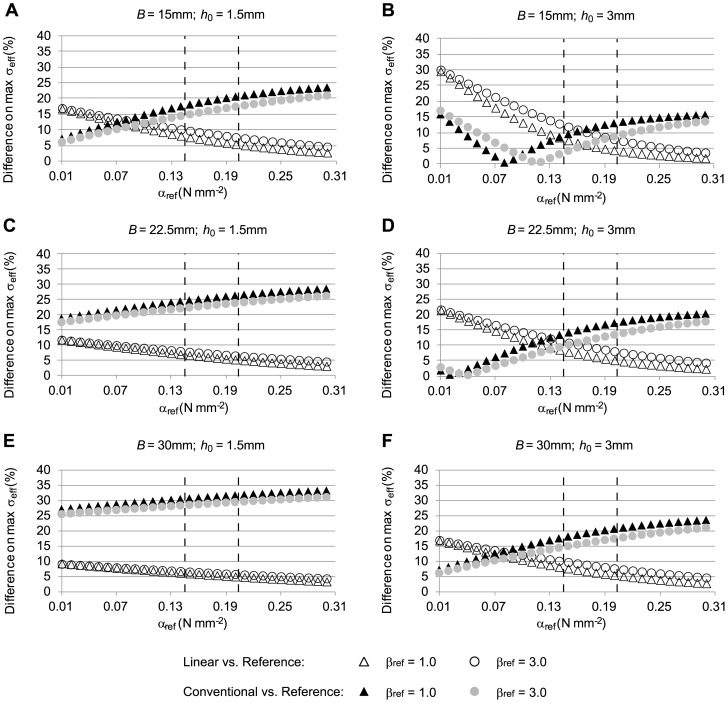
Figure 6. Relative differences in maximum effective wall stress distributions for a tubular arterial model.
Models simulated are the same as for Fig. 5, but differences in maximal wall stresses with respect to reference stresses, computed using Eq. 32, are reported instead. The reported material coefficients αref and βref correspond to those of the reference model. RV material properties (α = 0.174 N/mm2, β = 1.881 N/mm2) were used in the conventional model, and a constant elasticity (E = 8.4×10⁹ N/mm2) was used in the linear model. Applied internal pressure was 0.016 N/mm2 (120 mmHg). The initial geometry was varied to represent different aneurysm sizes and wall thicknesses. The dashed lines indicate the physiological range of the material property values for αref.

