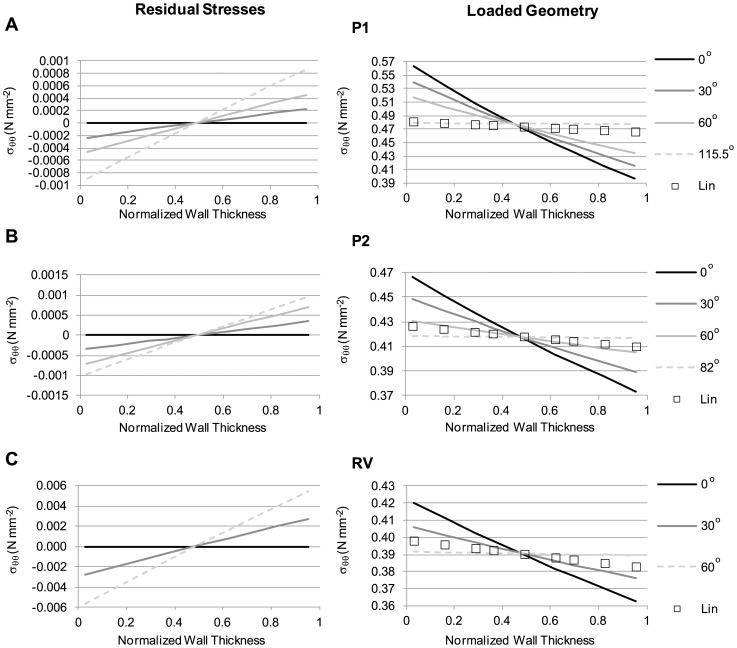
Figure 11. Effect of varying opening angle on circumferential residual stresses and loaded stress distributions.
The model employed to compute residual stresses is schematically shown in Fig. 3. The angle θ was varied as indicated (with θ = 0° corresponding to the case of no residual stresses), and results obtained from employing different tissue material properties, listed in Table 1, are presented: (A) P1; (B) P2; (C) RV material properties. Results show residual stresses (left panels) in the unloaded (closed) configuration; and wall stresses after applying an internal pressure, p = 0.016 N/mm2 (right panels). Circumferential wall stresses obtained using the linear model are included for comparison. For the cases considered, the unloaded, closed configuration, which exhibits residual stresses, was the same, and characterized by b 0 = 30 mm and a wall thickness of 1.5 mm. As the opening angle increased, the magnitude of residual stresses and gradient of stresses across the wall increased (right column). The magnitude of wall stresses in the loaded configuration, in contrast, decreased, and the gradient of wall stresses across the wall thickness decreased. Irrespective of the material properties employed, as θ increased, the magnitude of the stresses obtained using the nonlinear material properties (P1, P2, RV) approached the stress values obtained using the linear model. Dotted lines show the case at which a relatively uniform stress distribution across the wall was obtained.

