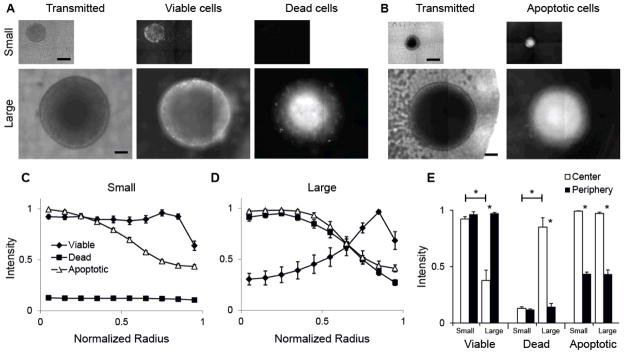
Figure 2. Distribution of cell viability and apoptosis in small and large cylindroids.

A) Transmitted and fluorescence images of a small and large cylindroid. Fluorescence images show location of viable and dead cells using the Live/Dead cell viability assay. Scale bars are 200 μm. B) Transmitted and fluoresce images of a small and large cylindroids stained to identify activated caspase-3, an indicator of apoptosis. C, D) Radial profiles of viable cells, necrotic cells, and cells with activated caspase-3 in populations of small (C; diameter<500 μm; n=5 for Live/Dead; n=6 for apoptosis) and large (D; diameter>500 μm; n=5 for live/dead; n=3 for apoptosis) cylindroids. Some errors are small and the bars are obscured by data markers. E) Extent of viability, necrosis and apoptosis in the interior and peripheral 10% of the cylindroid populations. Cell viability was greater in the center of small compared to large cylindroids (*, P<0.001); cell death was greater in the center of large cylindroids (*, P<0.001); and apoptosis was greater in the center compared to the periphery for both small and large cylindroids (*, P<0.001). In large cylindroids, viability was greater in the periphery (*, P<0.001), and death was greater in the center (*, P<0.001).
