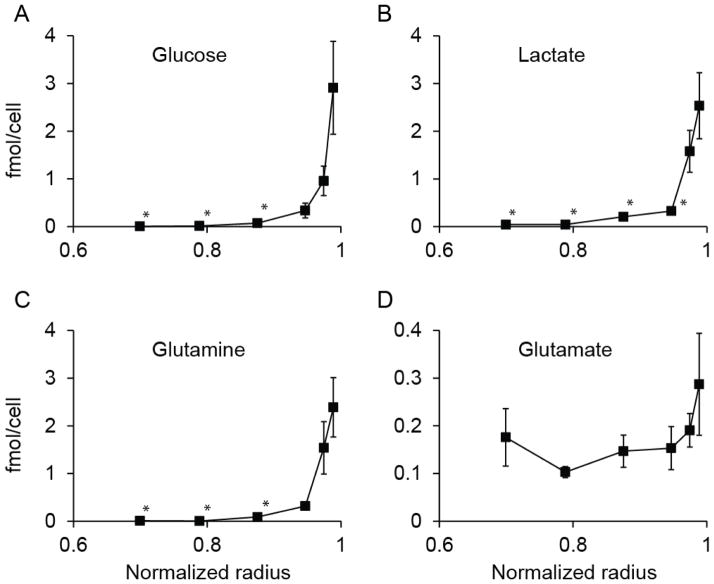
Figure 4. Concentration profiles of four intracellular metabolites in spheroids.
Profiles of (A) glucose, (B) lactate, (C) glutamine and (D) glutamate as functions of normalized radius (n=3). The average spheroid radius was 287μm. Each point represents a single layer of cells removed from the outer edge of a group of spheroids. The concentrations of glucose and glutamine (A, C) in the inner three layers was lower than the outer edge (*, P<0.05). The concentration of lactate (B) was lower in the inner four layers than the edge (*, P<0.05). The concentration of glutamate (D) did not decrease with radius. Error bars represent standard error of mean.

