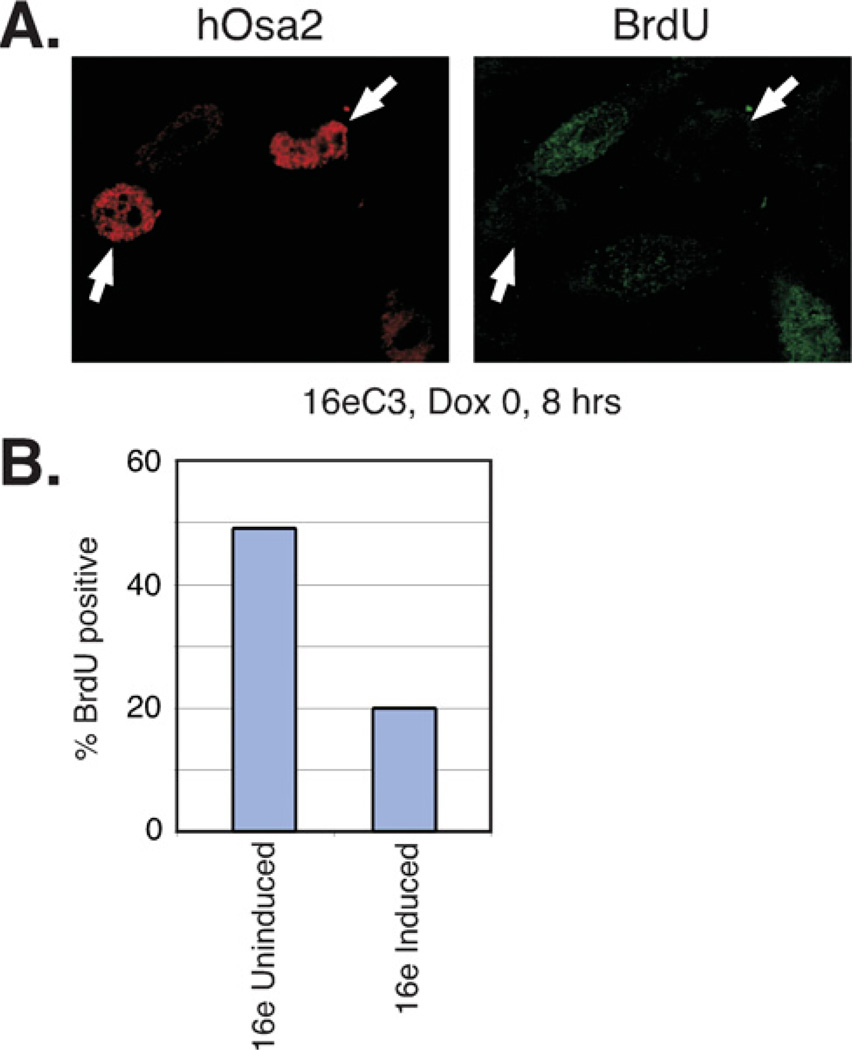
Figure 3. Induced expression of hOsa2 decreases BrdU incorporation.
(A) 16eC3 cells induced for 8h were labelled with BrdU for 2h then fixed and examined by indirect immunofluorescence with an antibody to hOsa2 or BrdU. These cells showed heterogeneous expression of hOsa2. The arrows point to those expressing hOsa2 at high levels.
(B) Quantification of the percentage of BrdU positive cells in uninduced and induced 16eC3 cell cultures.

