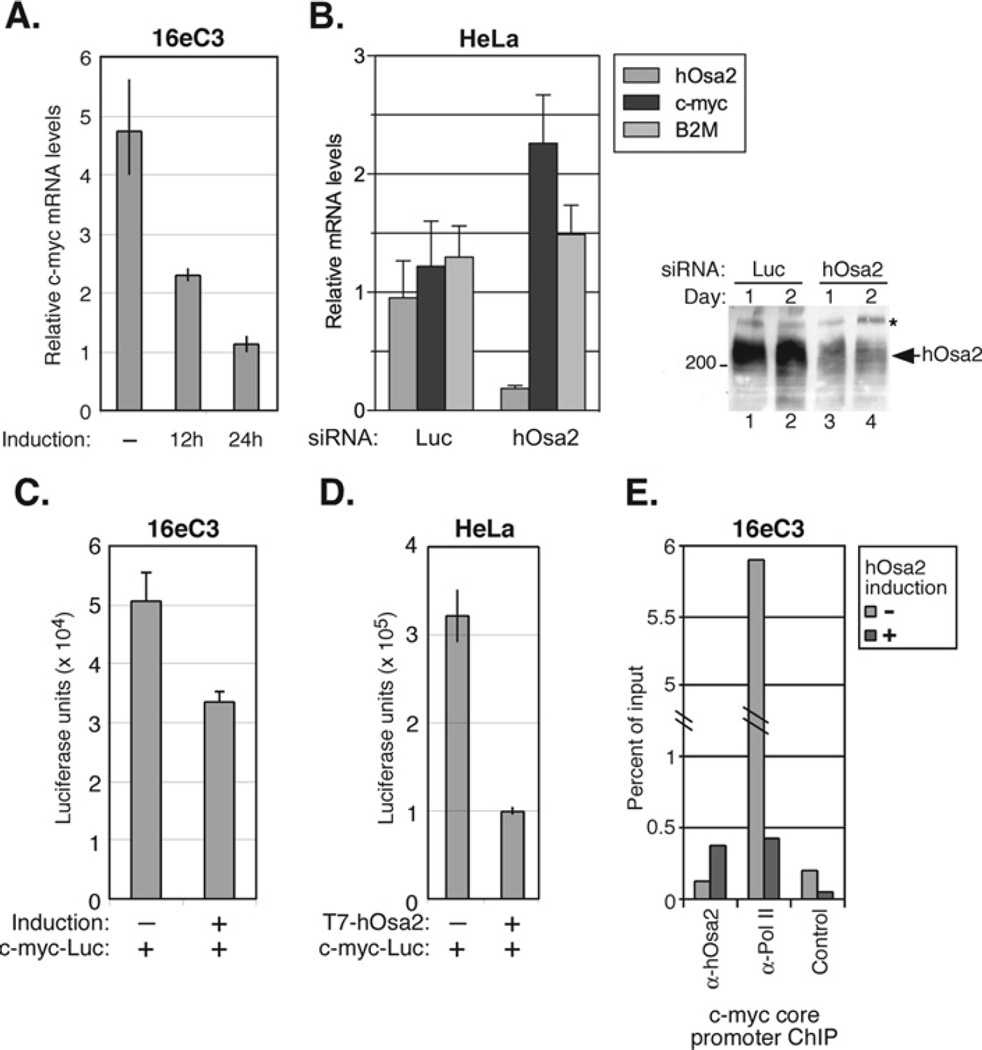
Figure 5. c-myc mRNA levels are reduced after the expression of hOsa2, but increased after the knockdown of endogenous hOsa2.
(A) The total RNA prepared from16eC3 cells uninduced or induced for 0, 12 or 24 h was used in RT-PCR with primers corresponding to c-myc exon1. The value obtained for each reaction was normalized to that of 28S rRNA. The experiment was performed in duplicate and the spread of the mean is shown for each sample. (B) HeLa cells were transfected with siRNA against luciferase or hOsa2 by electroporation and the total RNA was prepared 48 h later. RT-PCRs were carried out using primers to hOsa2, c-myc and B2M. The experiment was performed in triplicate. The immunoblot on the right shows reduced levels of endogenous hOsa2 protein, 1 and 2 days after transfection of HeLa cells with siRNA. (C) 16eC3 cells were transiently transfected with a c-myc promoter–luciferase reporter plasmid (0.5 µg) using Lipofectamine™ Plus, and hOsa2 expression was induced 8 h later. The cells were harvested after 24 h and luciferase activity was measured and normalized to β-galactosidase activity from the co-transfected LacZ plasmid (0.25 µg). The assay was performed in triplicate. (D) HeLa cells were transiently transfected by the calcium phosphate precipitation method with a c-myc promoter–luciferase reporter plasmid (0.5 µg) and a plasmid expressing T7-hOsa2(16e) (1 µg). The cells were harvested after 48 h and the luciferase activity was measured and normalized to β-galactosidase activity from the co-transfected LacZ plasmid (0.25 µg). The experiment was performed in duplicate and the spread of the mean is shown for each sample. (E) 16eC3 cells uninduced ( − ) or induced for 24 h (+) were cross-linked with formaldehyde and a ChIP assay was performed using the indicated antibodies. The products were detected by real time PCR with primers specific for the c-myc core promoter region and plotted as percentage of input. The control antibody was anti-p21 antibody.

