
Figure 4. Rarefaction plots of 16S rRNA gene sequences obtained from fecal samples.
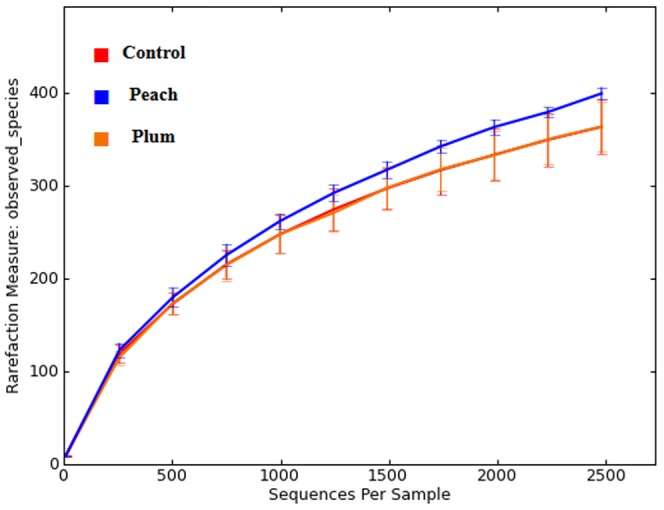
Lines denote the average of each group; error bars represent the standard deviation. This analysis was carried out using a randomly selected 2489 sequences per sample.