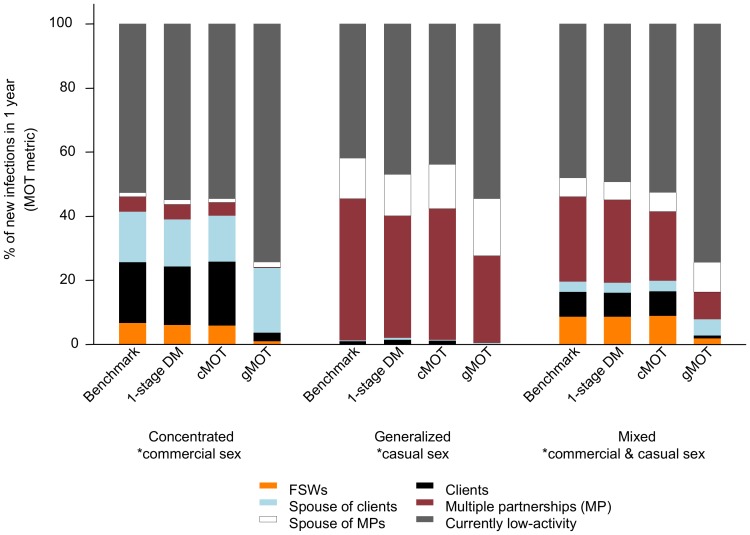
Figure 2. Model-predicted distribution of new HIV infections over one year (MOT metric) in three epidemic types.
The benchmark Modes of Transmission (MOT) metric is obtained from the 4-stage dynamical model, and corresponding MOT metric obtained from the 1-stage dynamical model (1-stage DM), complex MOT (cMOT), and generic MOT (gMOT) models. The MOT metric reflects the fraction of new HIV infections acquired by different risk groups (colored bars) estimated for 2012 using data from the synthetic epidemics.*local epidemic drivers.

