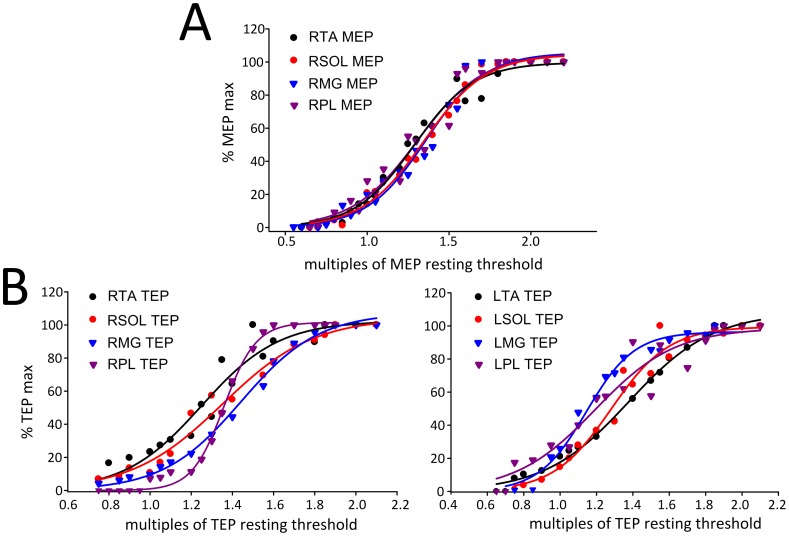
Figure 2. Recruitment curves of MEPs and TEPs.
(A) MEPs recorded from 14 subjects from the right (R) TA, SOL, MG, and PL muscles while seated are plotted against the maximum stimulator output, which was normalized to the associated MEP resting threshold. (B) TEPs recorded from 7 subjects from the right and left TA, SOL, MG, and PL muscles while seated are plotted against the stimulation intensities, which were normalized to TEP resting threshold. TA: tibialis anterior. SOL: soleus. MG: medialis gastrocnemius. MEPs: motor evoked potentials. TEPs: transpinal evoked potentials.

