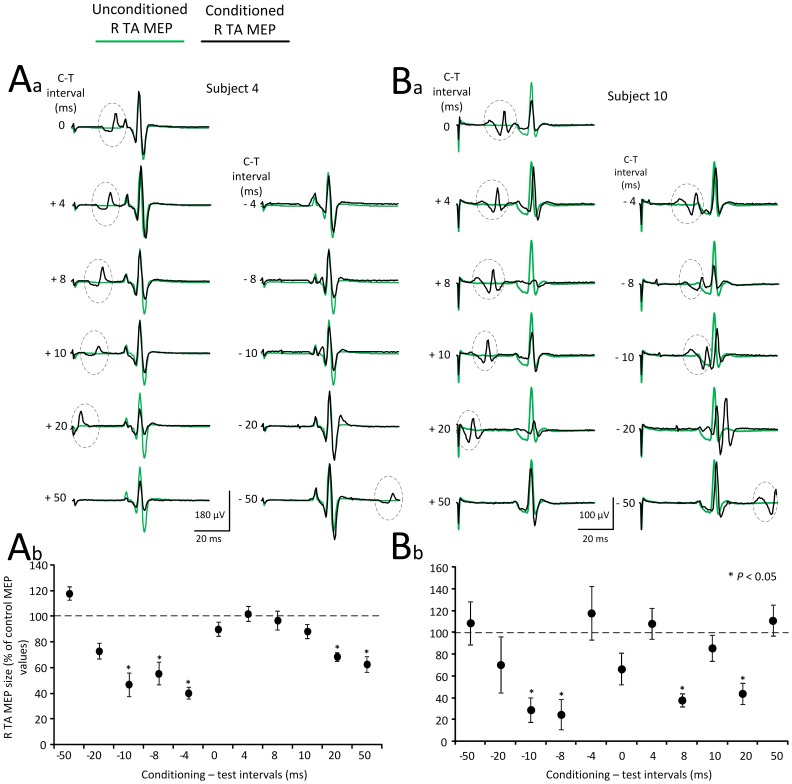
Figure 3. Effects of transcutaneous electric stimulation of the spine (tsESS) on TA MEPs.
(Aa, Ba) Waveform averages of the right TA MEPs from two representative subjects under control conditions (green lines) and following tsESS (black lines) for all conditioning-test (C-T) intervals tested. The action potential within the dotted circle identifies the right TA TEP induced by the conditioning tsESS stimuli. All EMGs are shown as captured and subtraction to counteract summation of MEPs and TEPs was not applied. (Ab, Bb) Overall mean amplitude of the conditioned right TA MEPs for the same subjects (subjects 4 and 10), in which the net conditioning stimulus effect (i.e., the TEPs induced by the conditioning tsESS were subtracted) is indicated. Asterisks indicate statistically significant differences of conditioned MEPs from control values (P<0.05; one-way ANOVA). Error bars denote the SEM. TA: tibialis anterior. MEPs: motor evoked potentials. TEPs: transpinal evoked potentials. tsESS: transcutaneous electric stimulation of the spine.

