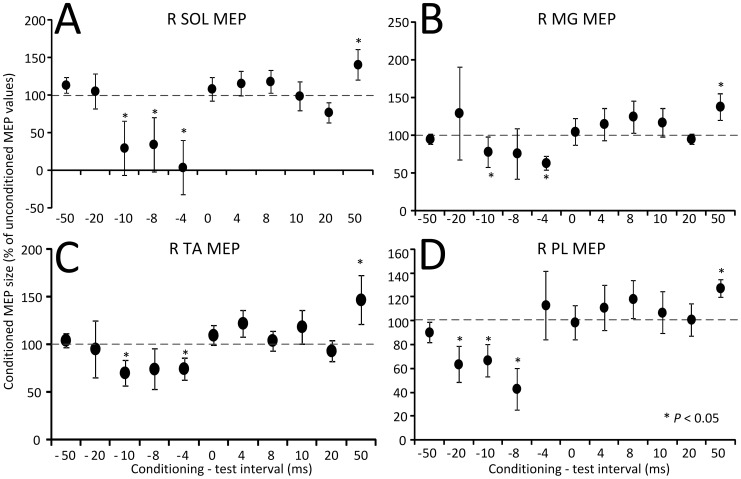
Figure 4. Effects of noninvasive transpinal stimulation on MEPs.
Amplitude of MEPs recorded from the right (R) soleus (SOL), medialis gastrocnemius (MG), tibialis anterior (TA), and peroneus longus (PL) muscles following transcutaneous electric stimulation of the spine over the thoracolumbar region from 14 subjects. On the abscissa the conditioning-test interval (ms) tested is indicated. A negative C-T interval denotes that transcutaneous electric stimulation of the spine was delivered before TMS. Asterisks indicate statistically significant differences of conditioned MEPs from control values (P<0.05; one-way ANOVA). Error bars denote the SEM.

