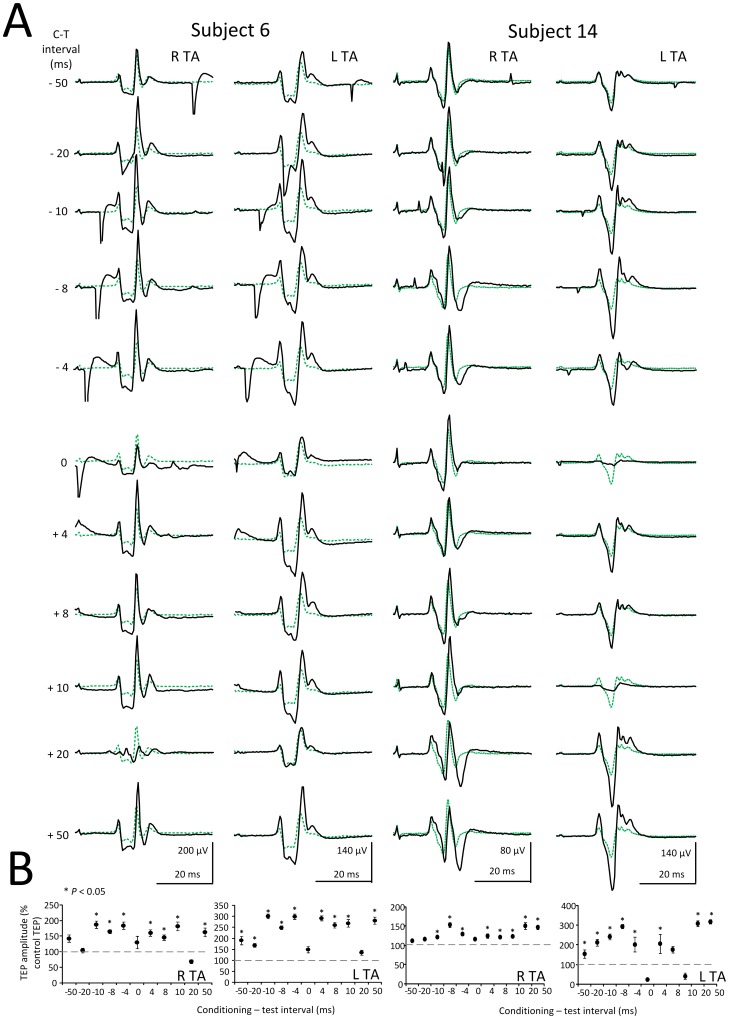
Figure 6. Effects of subthreshold TMS on right and left TA TEPs.
(A) Waveform averages of the right (R) and left (L) TA TEPs in two additional subjects (subject 6 and subject 14) under control conditions (green dotted lines) and following subthreshold TMS (solid black lines) for all conditioning-test (C-T) intervals tested. (B) Overall mean amplitude of the conditioned TEPs for the same subjects. Asterisks indicate statistically significant differences of conditioned TEPs from control values (P<0.05; one-way ANOVA). Error bars denote the SEM.

