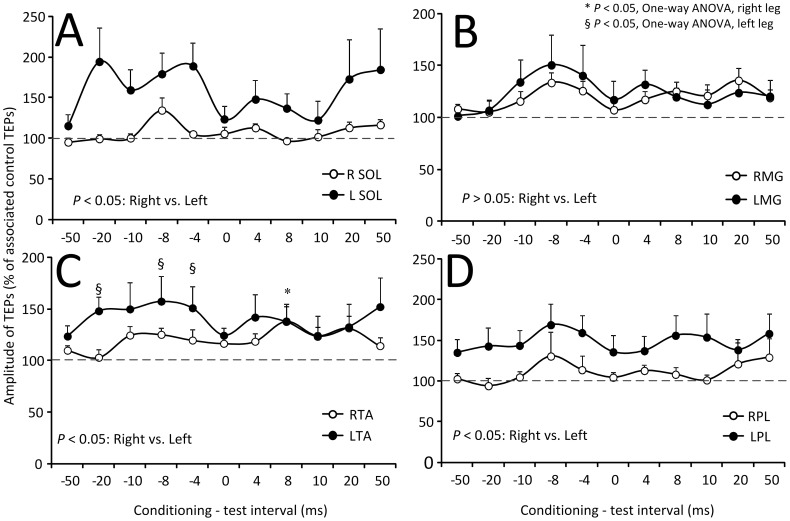
Figure 7. Modulation of TEPs by subthreshold TMS.
Overall mean amplitude of TEPs recorded from the right (R) and left (L) soleus (SOL), medialis gastrocnemius (MG), tibialis anterior (TA), and peroneus longus (PL) muscles following transcranial magnetic stimulation (TMS) delivered at intensities that motor evoked potentials were not evoked. On the abscissa the conditioning-test (C-T) interval (ms) is indicated. A negative C-T interval denotes that TMS was delivered after transcutaneous electric stimulation of the spine. Symbols “*” and “§” denote statistically significant differences of conditioned TEPs from control values for the right or left side TEPs, respectively. Error bars denote the SEM.

